Figure 4.

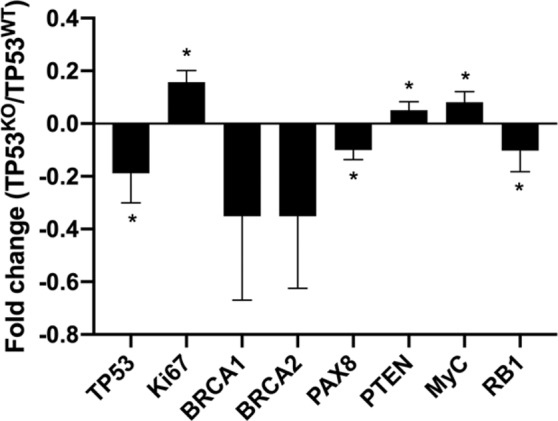
Fold change of relative mRNA expression of TP53, Ki67, BRCA1/2, PAX8, PTEN, Myc and RB1 in TP53KO vs. TP53WT oviduct-on-a-chip platforms. * indicates statistically significant changes (paired samples t-test, p < 0.05).

Fold change of relative mRNA expression of TP53, Ki67, BRCA1/2, PAX8, PTEN, Myc and RB1 in TP53KO vs. TP53WT oviduct-on-a-chip platforms. * indicates statistically significant changes (paired samples t-test, p < 0.05).