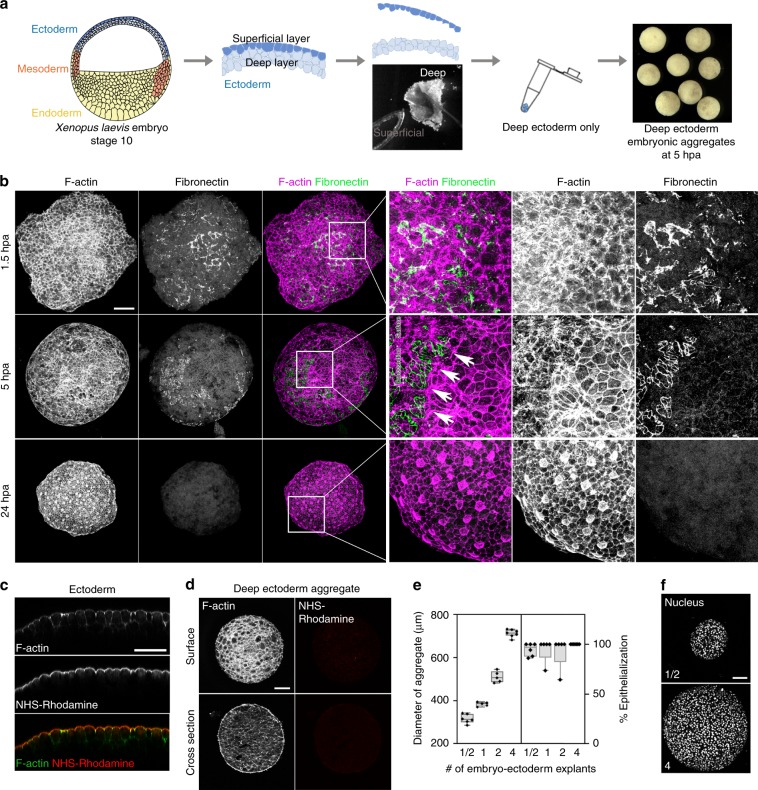
Fig. 1. Surface cells of deep ectoderm aggregates undergo epithelial-like phenotypic transition.
a Schematic of the assembly of deep ectoderm cell aggregates from early Xenopus embryo (Stage 10). b Surface F-actin and fibronectin (FN) from maximum intensity projections at 1.5, 5, and 24 h post aggregation (hpa). Three panels on the right are higher resolution views of the inset region (white box) in the third column. Arrows indicate margin of FN where dense circumapical F-actin suggests epithelial cell phenotype. Scale bar for aggregate images is 100 µm. c Transverse sectional view through the ectoderm of NHS-Rhodamine surface-labelled embryos. Scale bar, 50 µm. Rhodamine is restricted to the apical surface of outer epithelial cells. d Deep ectoderm aggregates generated from NHS-Rhodamine surface-labelled embryos. Scale bar, 100 µm. Lack of rhodamine indicates absence of contaminating epithelia. e Percent of epithelial cell phenotype found on the surface of different-sized deep ectoderm aggregates at 24 hpa. Aggregates assembled with varying amounts of embryo-ectoderm explants (1/2 explant, n = 6; 1 explant, n = 5; 2 explants, n = 5; 4 explants, n = 8). Box plot shows minimum, first quartile, median, third quartile, and maximum values. f Labeled nuclei shown in deep ectoderm aggregates from 1/2- and 4-embryo-ectoderm explant containing aggregates. Scale bar, 100 µm.

