
Figure 4.
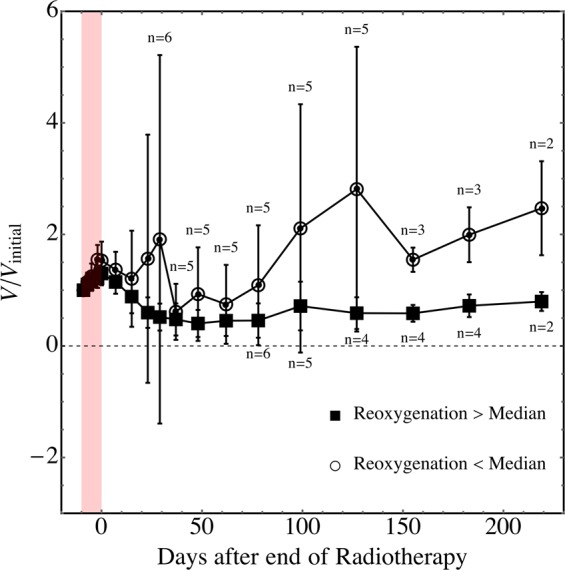
Tumour growth inhibition was greater for tumours that reoxygenated more during radiotherapy. Mean scaled tumour volumes—volumes divided by volumes at the start of radiation—are shown as a function of time after the end of radiotherapy for irradiated tumours segregated into two groups based on reoxygenation: ΔHF1.4 < −0.09 (the median value for ΔHF1.4) and ΔHF1.4 > −0.09. Error bars indicate the standard deviation of scaled tumour volumes in each group. The number of mice n in each group are shown above and below error bars; where not shown, n = 6. The analogous plots using ΔHF3σ are essentially the same. Mann-Whitney U test p-values were 0.08, 0.12, 0.02, and 0.02, 0.053 at 50, 100, 127, 183, and 219 days after completion of SBRT, respectively. The test was not significant (p > 0.05) at the last volume measurement (219 days post-SBRT) because only 4 mice lived to this time.