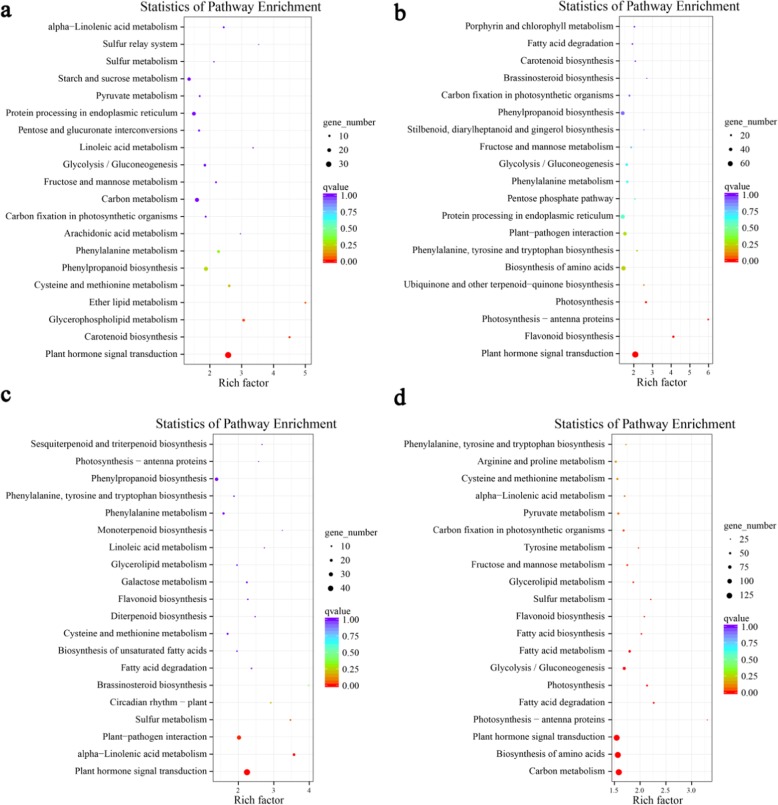
Fig. 2. KEGG analysis of DEGs identified from pairwise comparisons between developmental stages during fruit development.
a–d Stage 1 vs. Stage 2 (a), Stage 2 vs. Stage 3 (b), Stage 3 vs. Stage 4 (c), and Stage 4 vs. Stage 5 (d). The Q value is the multiple hypothesis test-corrected P value. The q value ranges from [0-1]. The closer that number is to 0, the more significant the enrichment is. The rich factor refers to the ratio of the number of genes among the DEGs located in a number of pathways to the total number of genes in the pathway entries in all of the annotated genes. The greater the rich factor, the greater the degree of enrichment is49

