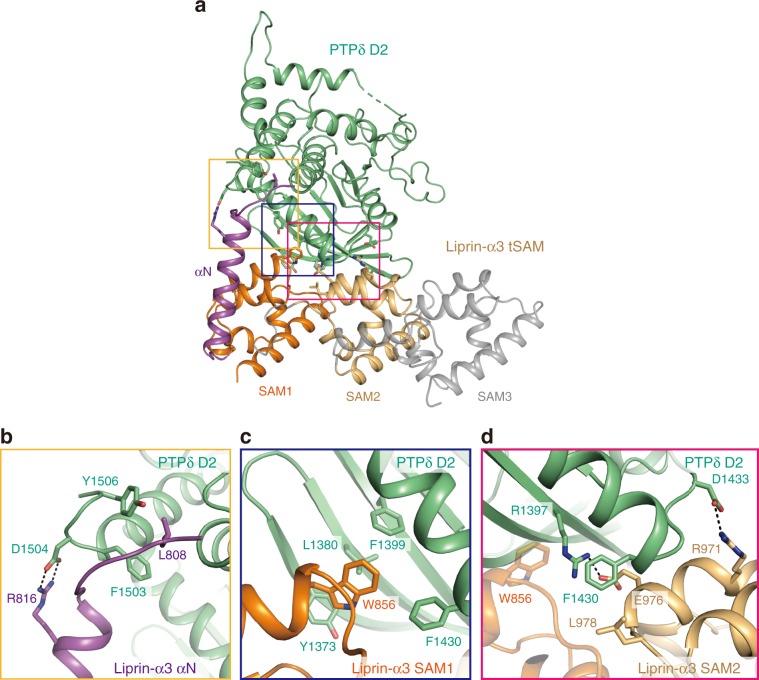
Fig. 2. Binding interfaces between PTPδ D2 and Liprin-α3 tSAM.
a Overall view of the interaction between PTPδ D2 (green) and Liprin-α3 tSAM (αN, purple; SAM1, orange; SAM2, light brown; other regions, gray). Disordered regions are shown as dotted lines. The residues involved in the PTPδ D2–Liprin-α3 tSAM interaction are shown as sticks. Close-up views of the interactions of PTPδ D2 with αN (b), SAM1 (c), and SAM2 (d) of Liprin-α3 tSAM. The coloring scheme is the same as that in a. Hydrogen bonds are shown as dotted black lines.

