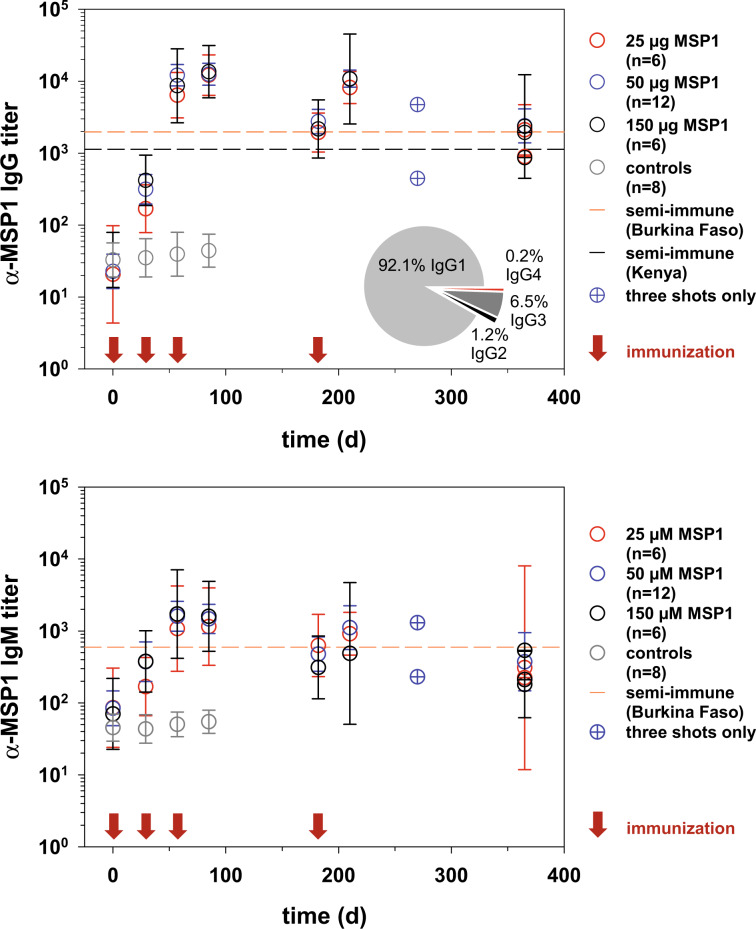
Fig. 2. IgG and IgM antibody titers against MSP1-D after immunization with SumayaVac-1.
Blood samples were collected from the vaccines on the days indicated and the a IgG-specific and b IgM-specific MSP1-D antibody titers were determined by ELISA. The data points represent the geometric means ± 95% confidence interval of each cohort. Crossed circles indicate samples from single individuals. Red arrows indicate the days of immunization. Dashed lines indicate reference titers obtained from pooled sera from semi-immune individuals from Nouna, Burkina Faso (orange line, n = 11)48 and from Kisumu, Kenya (black line, NIBSC code 10/198).104 Controls comprise the placebo and the GLA-SE vaccinees. The pie chart shows the average percentile distribution of IgG subclasses after three immunizations with SumayaVac-1 (day 85, n = 24).

