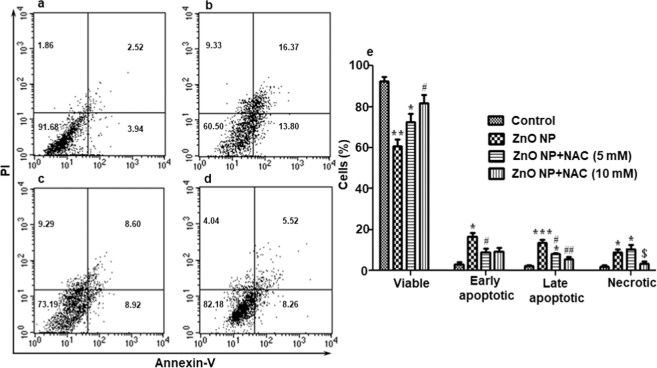
Figure 7.
Determination of induction of apoptosis in hemocytes by flow cytometric analysis using Annexin V-PI staining following ZnO NP exposure. (a–d) are the representatives of experimental results of one group. Control (a), exposed to ZnO NP (b), treated with ZnO NPs + 5 mM N-acetyl-L-cysteine (NAC) (c) and treated with ZnO NPs + 10 mM N-acetyl-L-cysteine (NAC) (d). The graph (e) represents the results of the whole experiment (3 replicates), the statistical analysis of which was done by One-way ANOVA test, followed by Tukey’s multiple comparison test. The results in control and vehicle-treated larvae were similar (data not given). *P < 0.05, **P < 0.01, ***P < 0.001 versus control. #P < 0.05, ##P < 0.01 versus 24 hour group. $P < 0.05 versus ZnO NPs + 5 mM (NAC).

