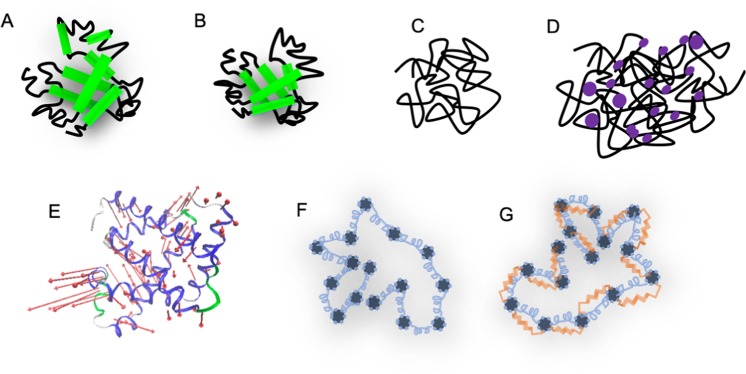
Figure 1.
(A–D) Schematic representations of the different folding states of apoMb: apoMb at pD 6 ((A) the 8 α-helices are marked with green), apoMb at pD 4 (B), apoMb at pD 2 (C), apoMb denaturated by GdmCl ((D) GdmCl are marked with purple). (E) Cartoon representation of the first non-trivial mode of myoglobin 2v1k.pdb. Loops are marked with green and grey, α-helices with blue, and the motion vectors with red arrows. (F,G) Sketches of a polymer interpreted by the Zimm (F) and ZIF (G) model: the beads are represented by the grey bullets and are interconnected though the springs (blue); additionally, in the ZIF model, the interchain friction is represented through the red dashpot. Each bead interacts with the solvent.

