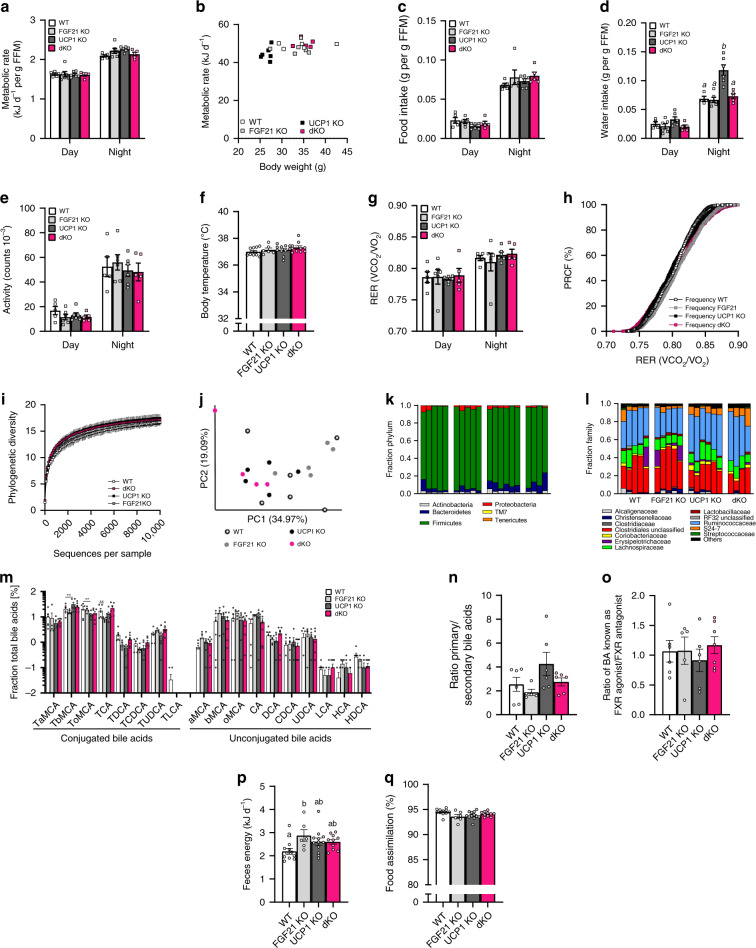
Fig. 3. Phenotyping of mouse energy metabolism.
After 9 wks of HFD feeding at room temperature, indirect calorimetry was performed with WT, FGF21 KO, UCP1 KO, and UCP1/FGF21 dKO mice. a Energy expenditure per fat free mass (FFM) and b correlation of body weight vs energy expenditure per animal, c day/night food intake per fat free mass, d day/night water intake per fat free mass, e day/night activity, f body temperature and g day/night respiratory exchange ratio (RER) with h percent relative cumulative frequency analysis (PRCF). After 3 wks of HFD feeding the gut microbiota and microbial metabolism were assessed. i Alpha rarefaction plot displaying species richness dependent on sampling depth (max depth = 9410 sequences per sample). j Principal coordinate analysis (PCA, weighted UniFrac) displaying β-diversity of the gut microbial community. The percentage of the variation explained by the plotted principal coordinates is indicated in the axis labels. Each dot represents a caecal community. Relative abundance at k phylum and l family level in caecal community of mice, displaying only relative abundances >1%. m Plasma bile acid (BA) profile and n ratio of primary to secondary BAs, and o ratio of BAs known as FXR agonist/FXR antagonist. p Feces energy content and q percent food assimilation were measured after 6 weeks of HFD feeding. a, b, e, g, h: n = 5/6/6/5 WT/FGF21 KO/UCP1 KO/dKO; c: n = 5/5/6/5, d: n = 4/6/6/5; i–l: n = 5/5/6/4; m, n: n = 6/5/6/7; o: n = 6/5/6/5; f, p, q: n = 11/6/12/10. Data (a–g, p, q) were analyzed by one-way ANOVA, followed by Bonferroni test and are presented as mean + SEM. Different letters indicate significant differences (P < 0.05). Data are presented as mean ± SD (i) or mean ± SEM (m–o) with significant differences shown as **P < 0.01. Source data of a–h, m–q, h are provided as a Source Data file.

