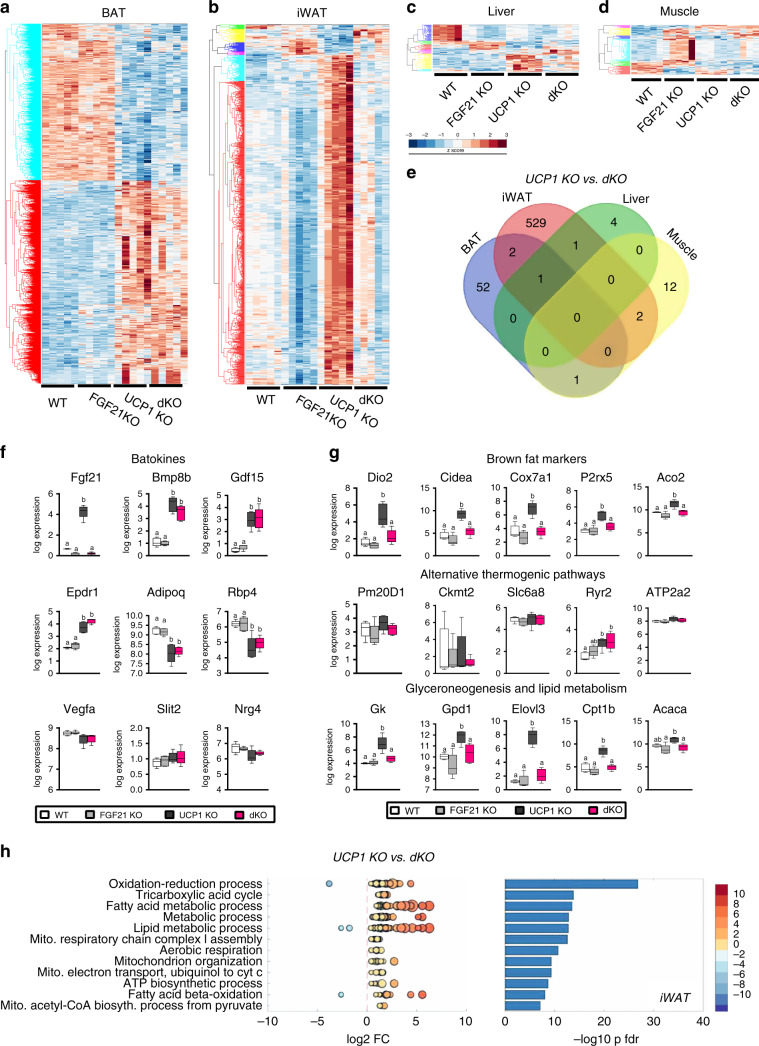
Fig. 5. Transcriptional profiling reveals FGF21-controlled browning of inguinal fat.
After 3 wks of HFD feeding at room temperature, organs were harvested for transcriptomic analysis. Heat maps illustrate all significantly expressed transcripts (adjusted p-value < 0.01) in a BAT, b iWAT, c liver and d muscle. Colors refer to gene expression z-score (b–d). e Venn diagram of all DEGs between UCP1 KO and dKO mice (adjusted p-value < 0.01). f, g Box plots showing the distribution of log2 gene expression level. The central mark indicates the median, and the bottom and top edges of the box indicate the 25th and 75th percentiles, respectively. The whiskers extend to the most extreme data points. f Batokine expression in BAT and in WAT, g marker genes of 'browning' (upper panel), genes associated with UCP1-independent thermogenesis (middle panel) and genes involved in glyceroneogenesis and lipid cycling (lower panel). h GO enrichment analysis of significantly regulated genes (adjusted p-value < 0.01) in iWAT of UCP1 KO vs. dKO. The top 12 regulated pathways are shown. Dot plots display expression of single genes related to the enriched pathways. Dot color refers to log2 FoldChange, while dot size refers to −log10 significance of regulation. Bar plots display significance of pathway enrichment. n = 5/5/5/5WT/FGF21 KO/UCP1 KO/ dKO. Data (f, g) were analyzed by one-way ANOVA followed by Bonferroni test with different letters indicating significant difference (P < 0.05).

