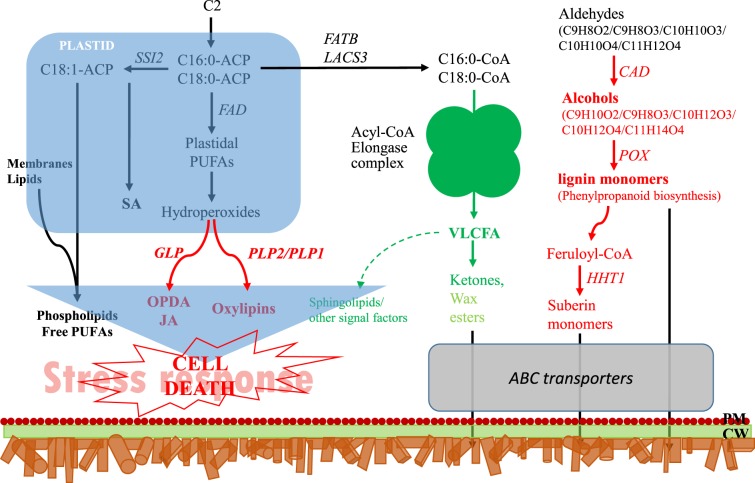
Fig. 8. Schematic diagram summarizing the metabolism and signaling in the russet fruit skin of sand pear.
The diagram was constructed based on the metabolic pathways summarized in the hypersensitive cell death response in Arabidopsis by Raffaele et al.65. Enzymes and partial diagrams marked in red or green indicate strongly enhanced or repressed regulation, respectively, in russet fruit skin at the transcript and/or protein levels. The differential regulation of wax esters in russet skin are indicated in red. We hypothesize that a low content of VLCFAs represses the biosynthesis of signaling molecules that could block or alter the signaling pathway, as indicated by the dotted arrow. PM plasma membrane; CW cell wall

