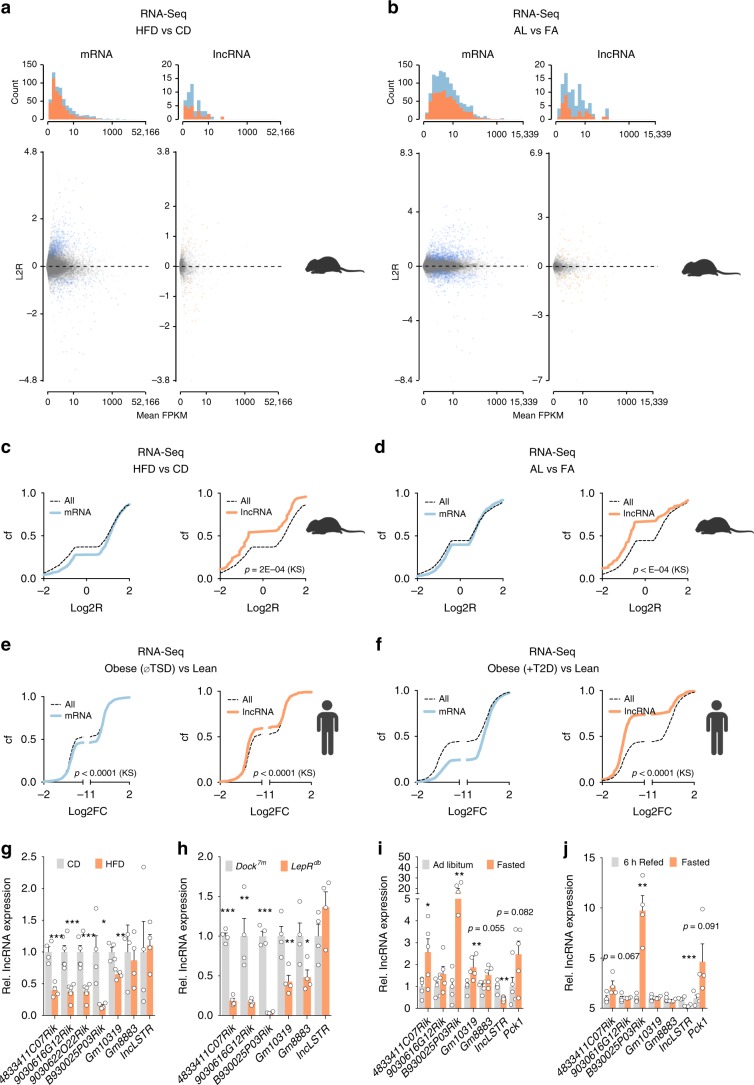
Fig. 1. Systemic nutrient states elicit opposing effects on liver mRNA and lncRNA expression.
a, b Histogram plot of read counts (top), scatter plot of reads counts vs. log2-transformed expression ratios (Log2R, bottom) and c, d cumulative frequency distribution (Cf) of Log2R of hepatic protein-coding mRNA (blue) and lncRNA (orange) expression changes. Data are from total RNA-Sequencing (RNA-Seq) in the liver of C57BL/6N mice after a, c HFD vs. (vs) CD feeding (n = 3 each) or b, d ad libitum feeding (AL) vs. 16 h of fasting (FA) (n = 4 each). e Log2R Cf of mRNA (blue) and lncRNA (orange) expression changes in the liver from lean (L) vs. obese (OB) patients without T2D (n = 4 per group). f Log2R Cf of mRNA (blue) and lncRNA (orange) expression changes in the liver of lean (L) vs. obese patients with T2D (n = 4 per group). g–j Quantitative reverse-transcription (RT) polymerase chain reaction (qPCR) for L-DIO-lncRNA expression in mice exposed to g HFD vs. CD feeding (n = 4–6). h Leprdb vs. Dock7m (n = 4). i AL vs. FA (n = 5 each) and j RF vs. FA (n = 4 each). c–f Statistical differences between mRNAs and lncRNAs were assessed using nonparametric Kolgomorov–Smirnov (KS) tests. p Values are given in the panels. Bar graphs represent mean ± s.e.m. with all data points plotted and differences in (g–j) were calculated using unpaired, two-tailed Student’s t tests. *p < 0.05, **p < 0.01, ***p < 0.001. Source data are provided as a Source Data file. Icons in a–f were created with BioRender.com.

