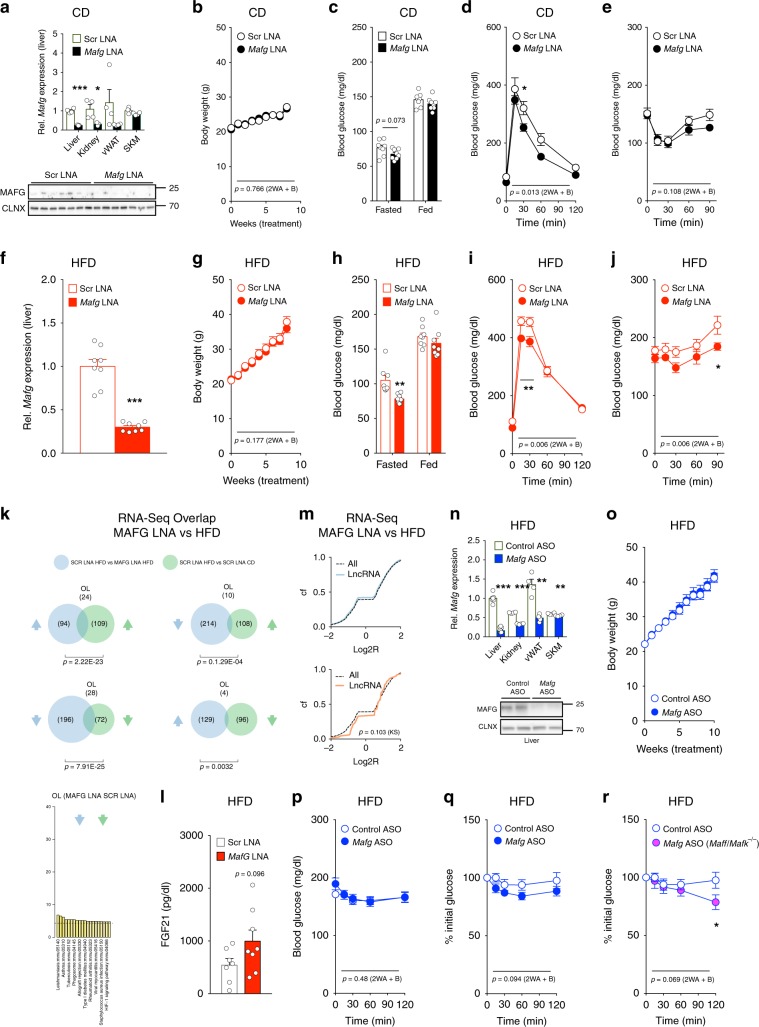
Fig. 4. MAFG loss protects from obesity-induced hyperglycemia.
a qPCR of Mafg expression in the liver from CD-fed 21-week-old C57BL/6N mice after 15 weeks of 10 mg kg−1 of Mafg (n = 8) or Scr LNA (n = 7) and immunoblot of MAFG and CLNX protein. b Body weight, c 16-h fasted, and random-fed glucose, d GTT, e ITT in CD-fed C57BL/6N mice after 6 and 5 weeks of Mafg or Scr LNA (n = 8). f qPCR of Mafg expression in the liver from 21-week-old HFD-fed mice after 15 weeks of Mafg or Scr LNA (n = 8). g Body weight, h 16-h fasted, and random-fed glucose, i GTT, and j ITT in HFD-fed C57BL/6N mice after 6 and 5 weeks of Mafg or Scr LNA (n = 8). k DGE overlap and enriched categories in livers from CD- or HFD-fed C57BL/6N mice after 10 weeks of Mafg or Scr LNA (n = 4). l FGF21 levels from 21-week-old HFD-fed C57BL/6N mice after 15 weeks of Mafg (n = 8) or Scr LNA (n = 7). m Log2R Cf of mRNA and lncRNA expression changes in 21-week-old HFD-fed mice after 15 weeks of Mafg or Scr LNA (n = 3). n qPCR of Mafg expression in liver and indicated tissues after 20 weeks of 5 mg kg−1 Mafg or Control ASO (n = 7 Mafg and n = 10 Control ASO in liver, n = 4 other tissues) and immunoblot of MAFG and CLNX in the liver of HFD-fed C57BL/6N mice after 2 days of Mafg or Control ASO. o BW in 16-week-old HFD-fed mice after 10 weeks of Mafg or Control ASO (n = 7 Mafg and n = 10 Control ASO). Absolute p relative q, r glucose during ITT in HFD-fed p, q C57BL/6N or r Maff/Mafk−/− (DKO) mice after 11 weeks of Mafg or Control ASO (n = 6 Control ASO, n = 9 Mafg ASO, and n = 6 Mafg ASO in DKO). Bar graphs represent mean ± s.e.m. with all data plotted and statistical differences calculated using a, c, f, h, n unpaired, two-tailed and l unpaired, one-tailed Student’s t test. m Kolgomorov–Smirnov b, d, e, g, i, j, p–r two-way ANOVA with Bonferroni post correction. k Significance of gene overlaps was calculated by using a hypergeometric distribution: *p < 0.05, **p < 0.01, ***p < 0.001. Source data are provided as a Source Data file.

