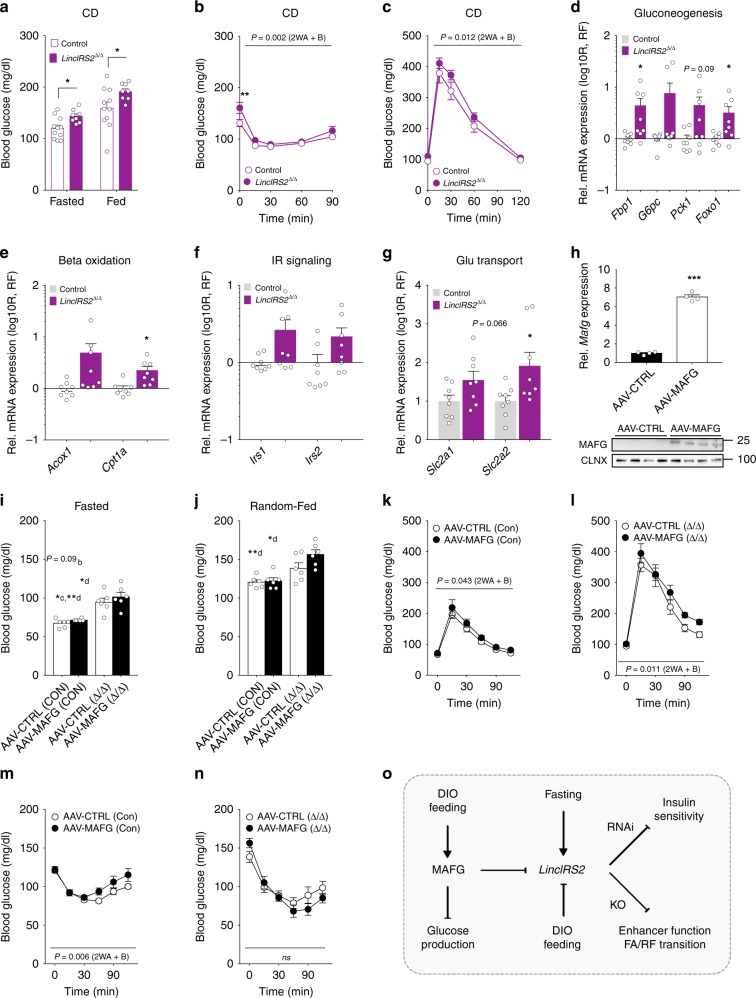
Fig. 6. CRISPR-mediated deletion of LincIRS2 impairs glucose metabolism in lean mice.
a Fasted and random-fed glucose in CD-fed 12-week-old LincIRS2∆/∆ mutant mice (n = 8) vs. wild-type littermates (n = 11). b ITT in 11-week-old and c GTT in 12-week-old, CD-fed LincIRS2∆/∆ (n = 8) vs. Control mice (n = 11). d–g qPCR of d gluconeogenic e oxidative f IR signaling and g glucose transporter expression in 8–15-week-old LincIRS2∆/∆ vs. LincIRS2∆/wt (n = 8) mice. h Hepatic qPCR and immunoblot (n = 4) from 18- to 20-week-old C57BL/6N 10 weeks after i.v. injection with 1× 10E11 genomic copies/animal encoding AAV8-CTRL or AAV8-MAFG. Fasted i and random-fed j glucose. k, l GTT and m, n ITT in CD-fed 18–20-week-old LincIRS2∆/∆ vs. C57BL/6N Controls (n = 12 each) with half of mice in each genotype (n = 6) i.v. injected with 1× 10E11 genomic copies/animal AAV8-CTRL or AAV8-MAFG. o Illustration of MAFG and LincIRS2 in regulation of hepatic glucose metabolism. Bar graphs represent mean ± s.e.m. with all data plotted and statistical differences were calculated using a, d–h unpaired, two-tailed Student’s t test. i, j One-way ANOVA with Bonferroni post correction for multiple testing. b, c, k–n Two-way ANOVA with Bonferroni post correction for multiple testing. Superscripts depict group comparisons for post analysis (a–f = comparison vs. columns 1–6) *p < 0.05, **p < 0.01, ***p < 0.001. Source data are provided as a Source Data file.

