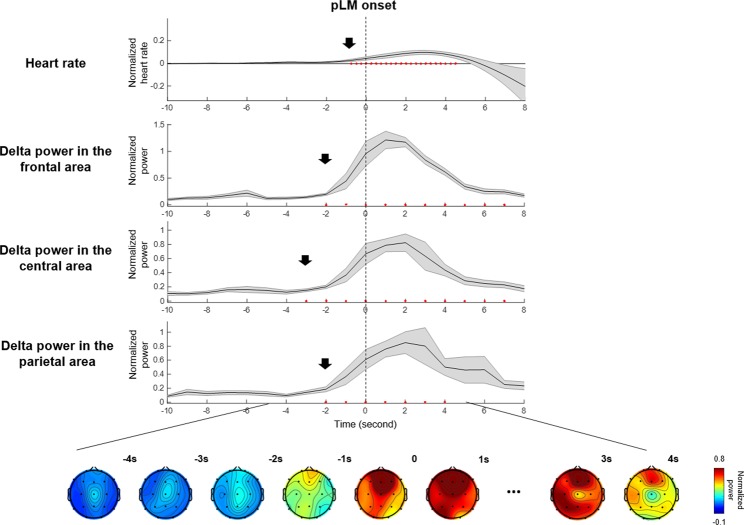
Figure 2.
Delta-band (2–4 Hz) power at three areas, topography, and heart rate changes near pLM onset. Delta-band power in the central area increased significantly at −3~−2 seconds before pLM onset. Heart rate increased at −1 second, and delta power in the frontal and parietal areas increased at −2~−1 seconds before pLM onset. Red dots indicate significant changes compared to the value of baseline interval using paired t-test (uncorrected p < 0.01). An EEG power value at −10 seconds indicates normalized power at −10~−9 seconds, and so on. Abbreviations: pLM, LM belonging to PLMS; LM, leg movement; PLMS, periodic leg movements during sleep.

