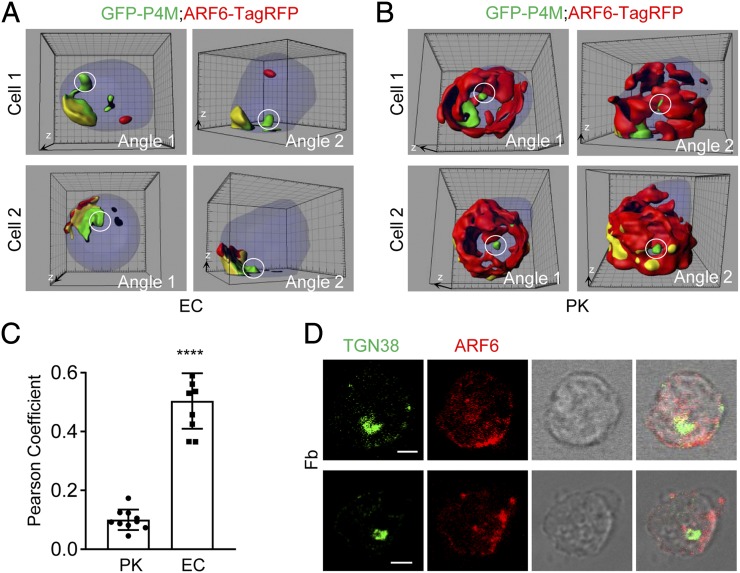
FIGURE 5.
ARF6 is copolarized with PM PtdIns4P in neutrophils attaching to activated endothelial cells. (A) ARF6 is polarized and colocalized with PM PtdIns4P in mouse neutrophils attached to endothelial cells under shear flow. Mouse neutrophils were transfected with GFP-P4M and ARF6-TagRFP plasmids and cultured for 6 h, then flowed through a chamber seeded with mouse endothelial cells pretreated with TNF-α and observed with a confocal microscope. Reconstructed 3D images of two representative cells are shown. The Golgi pool of PtdIns4P is denoted with a white circle. The 3D whole-cell contour is colored in purple, and the colocalization between PtdIns4P and ARF6 is marked in yellow. Each cell is shown in two different angles, in which angles 1 and 2 are referred to as dorsal view and side view, respectively. The raw 3D images are shown as Supplemental Videos 1, 2. The grid scales are 1 μm. (B) ARF6 is not polarized and minimally colocalized with PM PtdIns4P in mouse neutrophils attached to PK-coated surface under shear flow. Mouse neutrophils were transfected with GFP-P4M and ARF6-TagRFP plasmids and cultured for 6 h, then flowed through a chamber coated with polylysine at the rate of 1 dyn/cm2 and observed with a confocal microscope. Reconstructed 3D images of two representative cells are shown. The Golgi pool of PtdIns4P is denoted with a white circle. The raw 3D images are shown as Supplemental Videos 3, 4. The grid scales are 1 μm. (C) Quantification of colocalization of P4M and ARF6 in (A) and (B) conditions is shown as the Pearson coefficient. Each data point represents a cell. Data are presented as means ± SEM (Student t test). The experiments were repeated three times. ****p < 0.0001. EC, endothelial cell. (D) ARF6 is polarized, but not colocalized, with TGN38 in neutrophils on Fb. Mouse neutrophils were placed on Fb for 30 min, followed by immunostaining with the anti-TGN38 and anti-ARF6, then incubated with Alexa 488 (green)– and Alexa 633 (red)–conjugated secondary Abs, respectively. Representative optical section images of two cells are shown. Scale bar, 3 μm.

