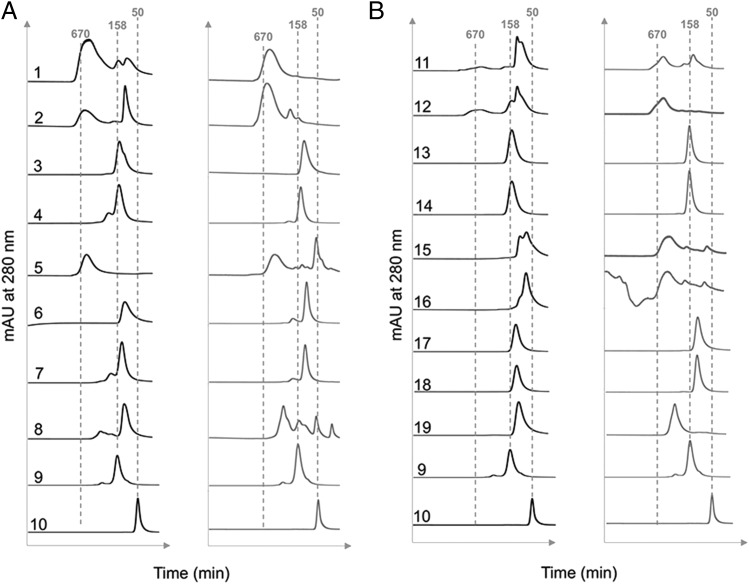
FIGURE 5.
Size-exclusion chromatography analysis of individual Fc mutants expressed by either HEK 293-F (black traces) or CHO-K1 cells (gray traces) as published previously (31). Dotted lines indicate the approximate molecular weights of the control 50 kDa Fc fragment (sample 10) or 158 kDa human IgG (sample 9). The m.w. standards (including 670 kDa thyroglobulin) or the indicated numbered mutants were run and eluted from the column as described in the Materials and Methods. (A) The C575A panel of mutants: 1, D221N/N297A/N563A/C575A; 2, D221N/N563A/C575A; 3, D221N/N297A/C575A; 4, D221N/C575A; 5, N563A/C575A; 6, N297A/C575A; 7, C575A; 8, Hexa-Fc; 9, IVIG (Gammagard); and 10, IgG1-Fc. (B) The C309L/C575A panel of mutants: 11, D221N/C309L/N297A/N563A/C575A; 12, D221N/C309L/N563A/C575A; 13, D221N/C309L/N297A/C575A; 14, D221N/C309L/C575A; 15, C309L/N297A/N563A/C575A; 16, C309L/N563A/C575A; 17, C309L/N297A/C575A; 18, C309L/C575A; and 19, C309L.

