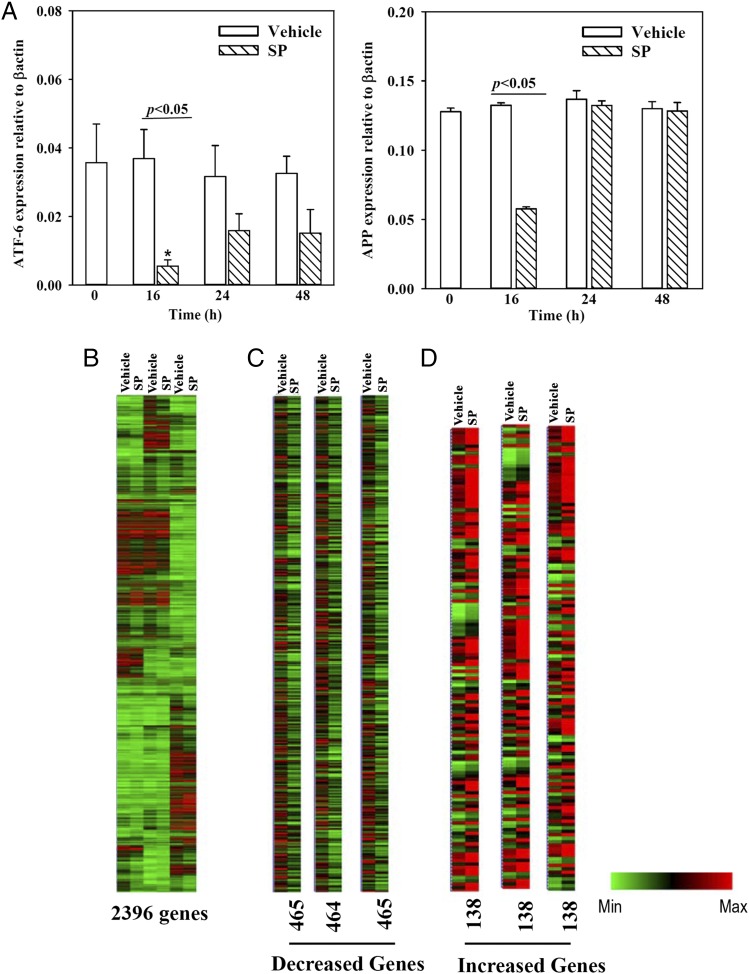
FIGURE 1.
Array validation and heatmap of the gene arrays. (A) Time-course studies were done with BM stromal cells stimulated with 10 nM SP. Total RNA was extracted and then studied by real-time PCR for APP and ATF-6. The results are presented as the mean ± SD (n = 5); each experiment was performed with stromal cells from a different donor. Each donor was tested in triplicate, and the mean of each was incorporated as one experimental point. The control (vehicle) values are shown for each time point. *p < 0.05 versus 24 and 48 h time points. (B) Heat map of microarray gene expression profile of all genes based on SP stimulation or vehicle treated in three biological replicates (each with a different BM donor). (C) Downregulated genes from the data in (B), and (D) upregulated genes based on the data in (B).

