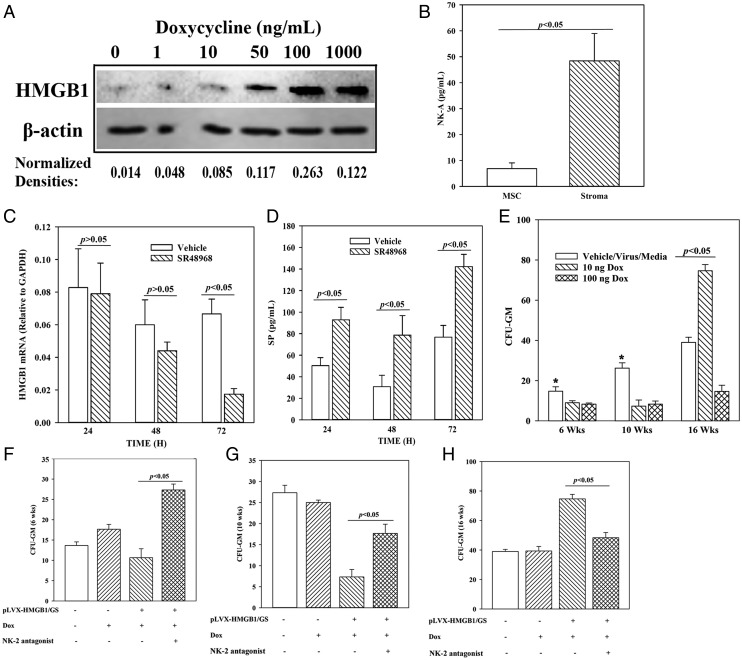
FIGURE 5.
Effects of HMGB1 and NK-A on LTC-ICs. (A) Dose-response analyses for HMGB1 levels in pLVX–HMGB1/GS–transduced stroma, which were cultured with different concentrations of Dox. After 24 h of Dox treatment, Western blot for HMGB1 was performed with whole cell extracts. The normalized band densities for two independent experiments are shown below the blot. (B) BM stroma and MSCs were analyzed for baseline NK-A by ELISA. The results are presented as mean ± SD pg/ml (n = 9). Cells were obtained from three different BM donors, with each donor studied in triplicate. (C) BM stroma was cultured in with 100 nM SR48968 or vehicle. At different times, media were collected and then studied for HMGB1 mRNA by real-time PCR. The results are presented as the mean ± SD (n = 3). Each experiment was performed with stroma from a different donor. (D) The studies in (C) were repeated, and instead, the culture media were analyzed for SP level by ELISA. The results are presented as the mean ± SD picogram per milliliter (n = 3). (E) LTC-IC cultures were established with stromal cells and transduced with an inducible HMGB1 (pLVX–HMGB1/GS) or vector alone. The transduced stroma was studied with or without 10 nM NK-2 antagonist (SR48968). HMGB1 was induced with 10 ng and 100 ng of Dox at initiation of culture. At 6, 10, and 16 wk, mononuclear cells were analyzed for CFU-GM in methylcellulose cultures. The results for cultures with vehicle, media alone, and virus without the HMGB1 insert (virus) were similar, and the data were combined (controls). The data are the mean ± SD (n = 4), each experiment performed with a different donor. Each experiment was performed with stroma from a different donor and tested in sextuplets, and the mean was added as one experimental point. *p < 0.05 versus Dox. (E–H) The cultures in (C) were repeated, except for HMGB1 induction with 10 ng Dox, in the presence or absence of 100 nM SR48968 (NK-2 antagonist). The total number of experiments and the results were similarly presented for cultures without antagonists (E), and those cultures with antagonists at weeks 6 (F), 10 (G), and 16 (H).

