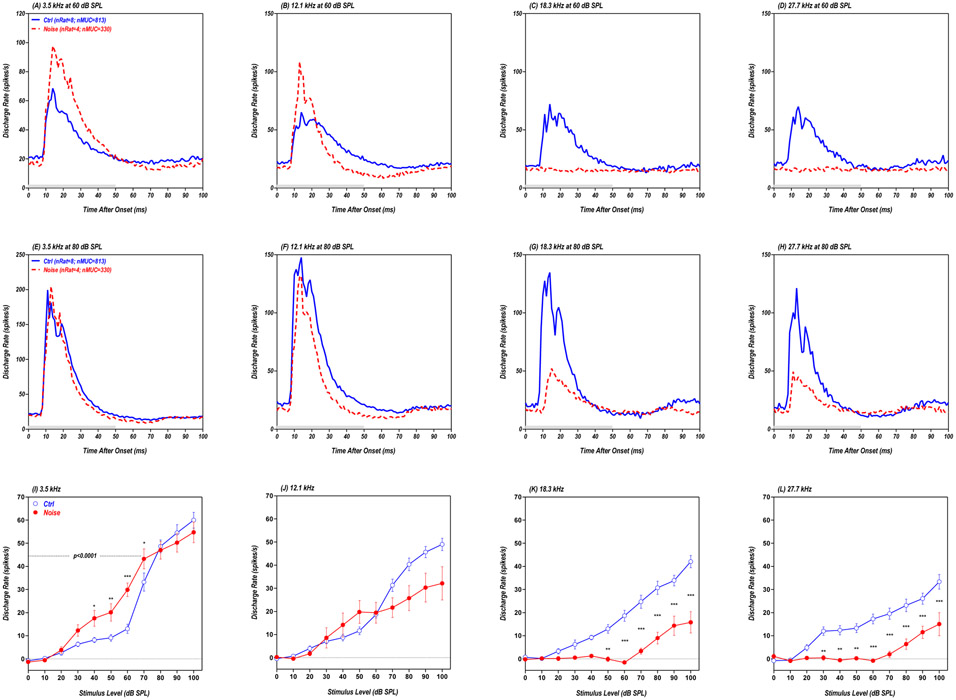
Figure 6:
(A-H) Grand mean population PSTHs (bin width: 1 ms) from AC showing the average discharge rate of 330 MUCs from four noise-exposed rats (red dashed line) and 813 MUCs from eight control rats (blue solid line). Data shown for 50 ms tone bursts (gray bar) presented at 3.5, 12.1, 18.3 or 27.7 kHz at 60 dB SPL (A-D, top row) or 80 dB SPL (E-H, middle row). (I-L) Mean (±SEM) population driven discharge rates vs. intensity shown for 3.5, 12.1, 18.3 and 27.7 kHz; mean values calculated over 50 ms time window (5-55ms window) of individual PSTHs. * p<0.05; ** p<0.01; *** p<0.001.

