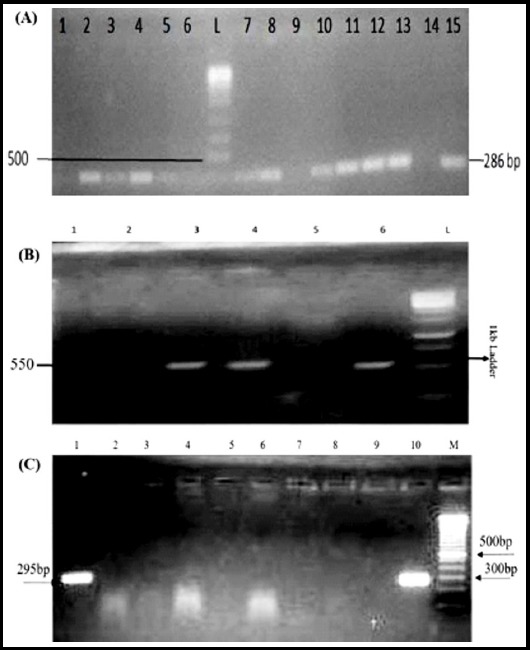
Fig.2.

Representative gel images showing PCR products of mecA, HVR and erm(C) genes. (A) Lane L shows ladder of 1kb, Lanes 2-8, 10-13, and 15 show shows amplification of mecA gene (286bp) and Lane-1 shows negative control. (B) Lane L shows ladder of 1 kb, Lanes 3, 4 and 6 show amplification of HVR gene (550 bp) Lanes 1, 2 and 5 show negative results. (C) Lane M shows 100 bp ladder, Lanes 1 and 10 show amplification of erm(C) gene (295bp), Lanes 2-9 show negative results.
