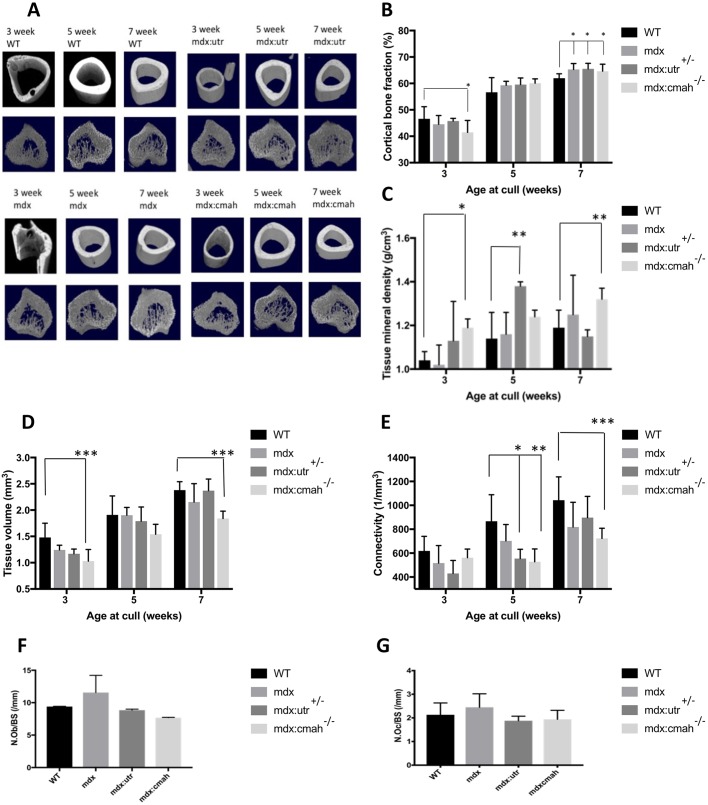
Fig. 3.
Bone parameters in muscular dystrophy mouse models. (A) Representative µCT images of tibial bone of all genotypes at 3, 5 and 7 weeks of age to show bone development (upper row, mid diaphyseal cortical bone; lower row, metaphyseal trabecular bone). (B) Compared to similarly aged WT mice, cortical bone fraction was lower in mdx:Cmah−/− mice at 3 weeks of age, but higher in all muscular dystrophy models at 7 weeks of age. (C) Cortical tissue mineral density was higher in mdx:Cmah−/− mice at 3 and 7 weeks of age and in mdx:Utrn+/− (shown as mdx:utr in the figure) mice at 5 weeks when compared to WT mice. (D) Trabecular tissue volume was lower in mdx:Cmah−/− mice at 3 and 7 weeks of age compared with WT. (E) Trabecular connectivity was lower in mdx:Utrn+/− mice at 5 weeks and mdx:Cmah−/− mice at both 5 and 7 weeks when compared to WT mice. (F,G) The number of osteoblasts (F; N.Ob/BS) and osteoclasts (G; N.Oc/BS) per bone surface were normal in all muscular dystrophy models at 5 weeks of age. Data are presented are mean±s.d. (n>6); *P<0.05, **P<0.01, ***P<0.001 compared to WT mice.

