Fig. 5.
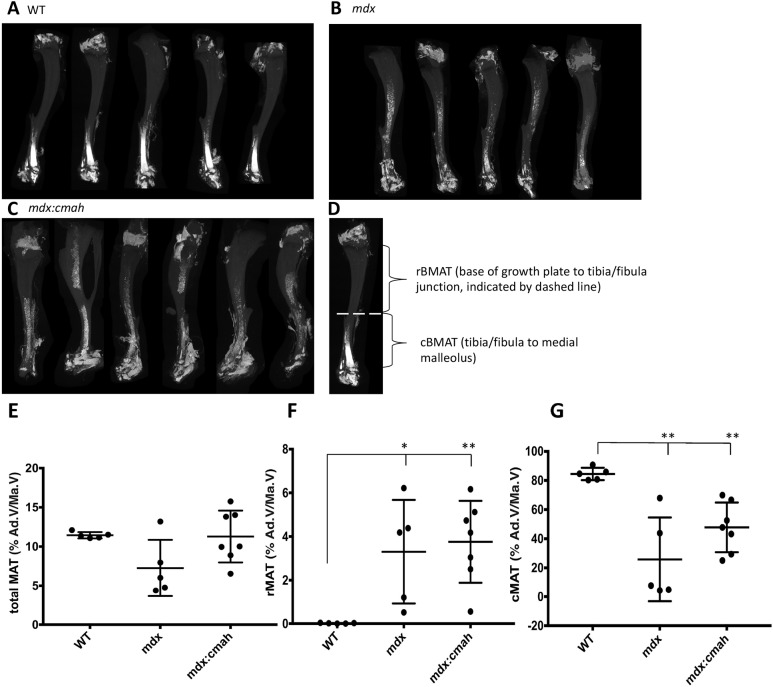
Bone marrow adiposity in muscular dystrophy mouse models. Three-dimensional µCT reconstructions of 7-week-old osmium-stained tibiae from: (A) WT, (B) mdx and (C) mdx:Cmah−/− mice. Bone appears grey and BMAT is white. (D) The boundaries of rBMAT and cBMAT within the tibia are shown; rBMAT lies proximal to tibia/fibula junction and cBMAT lies distal to tibia/fibula junction (shown by dashed line). (E-G) Percentage of (E) total BMAT, (F) rBMAT, (G) cBMAT. Data are presented as mean±s.d. (n=5). *P<0.05, **P<0.01 compared to WT mice. Ad.V/Ma.V, adipose volume/marrow volume.

