Fig. 2.
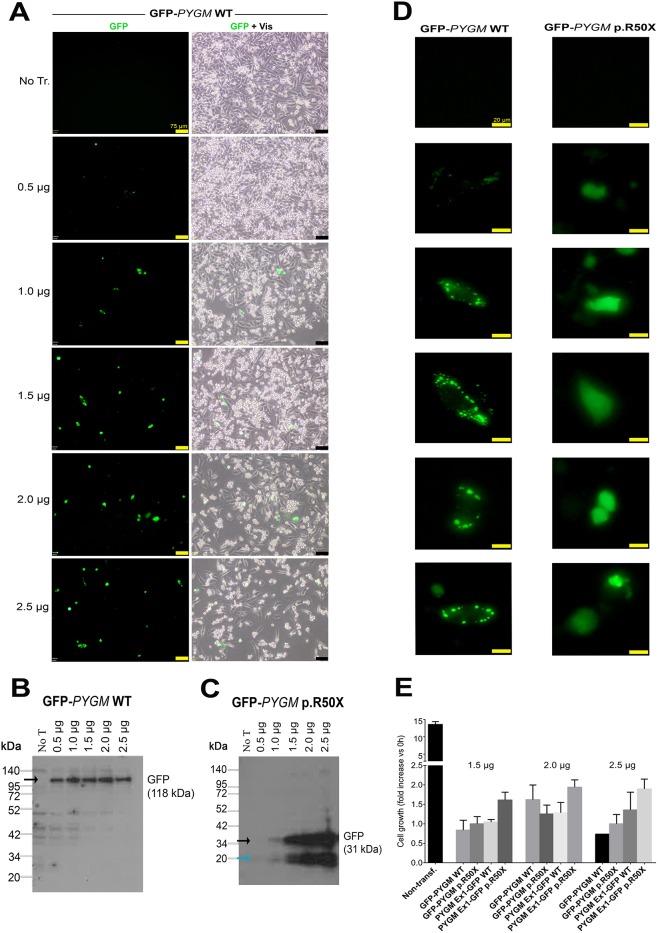
Transfection efficiency analysis using different amounts of the GFP-PYGM plasmids. (A) GFP PYGM fluorescence analysis of HeLa cells transfected with different amounts of GFP-PYGM WT. Images were obtained 24 h after transfection. Scale bars: 75 μm. (B,C) Western blot analyses of HeLa cells transfected with different amounts of GFP-PYGM WT and p.R50X plasmids. In both B and C, measures were performed 72 h after transfection. Black arrows mark specific protein bands; the blue arrow marks unspecific protein band. (D) GFP-PYGM fluorescence details of cells transfected with GFP-PYGM WT and p.R50X plasmids. Images were obtained 24 h after transfection. Scale bars: 20 μm. (E) Cell growth studies of HeLa cells transfected with 1.5, 2 and 2.5 µg GFP-PYGM WT and p.R50X plasmids. Two independent experiments were performed in each condition. Error bars indicate s.d. between the two independent experiments.

