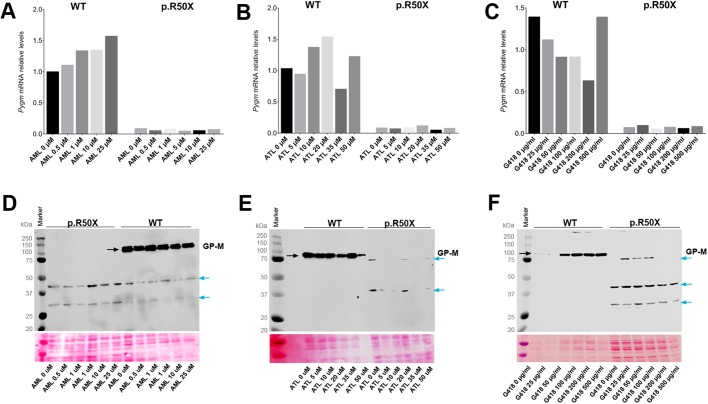
Fig. 6.
Nonsense-mediated decay (NMD) and read-through analysis in McArdle myotubes. (A-C) PYGM mRNA levels in WT and McArdle mouse myotubes after 72 h treatment with different concentrations of amlexanox (AML) (A), Ataluren (ATL) (B) and G418 (C), respectively. (D-F) GP-M protein levels in WT and McArdle mouse myotubes after 72 h treatment with different concentrations of AML (D), ATL (E) and G418 (F), respectively. Black arrows mark the specific PYGM protein band (94 kDa); blue arrows mark unspecific protein bands.

