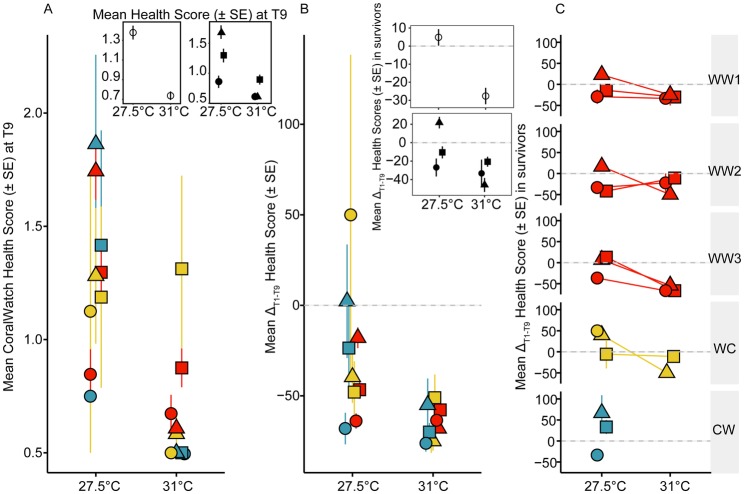
Fig. 5.
Juvenile bleaching. (A) Mean CoralWatch Health Score of juveniles (±s.e.) at the final timepoint (70 days, T9) across genetic backgrounds (red: Warm×Warm, yellow: Warm×Cool, blue: Cool×Warm). Insets in A show mean CoralWatch Health Score of juveniles (±s.e.) at the final timepoint across all treatments (left) and mean CoralWatch Health Score of juveniles (mm2±s.e.) at the final timepoint across three symbiont treatments (right) (circles: S. tridacnidorum, triangles: C. goreaui, squares: D. trenchii). (B) Bleaching (percent change in mean CoralWatch Health Score±s.e. from Timeinitial to Timefinal) of juveniles at 27.5°C and 31°C with different genetic backgrounds and symbiont treatments. Insets in B show percent change in bleaching (percent change in mean CoralWatch Health Score±s.e. from Timeinitial to Timefinal) of only surviving juveniles averaged across 27.5°C and 31°C and by symbiont treatments. (C) Bleaching (percent change in mean CoralWatch Health Score±s.e. from Timeinitial to Timefinal) of only surviving juveniles at 27.5°C and 31°C across familial crosses and symbiont treatments. Panels represent values that include the Health Score and mortality (see Materials and Methods for further explanation) unless otherwise stated by ‘in survivors’ (insets in B and all panels in C).

