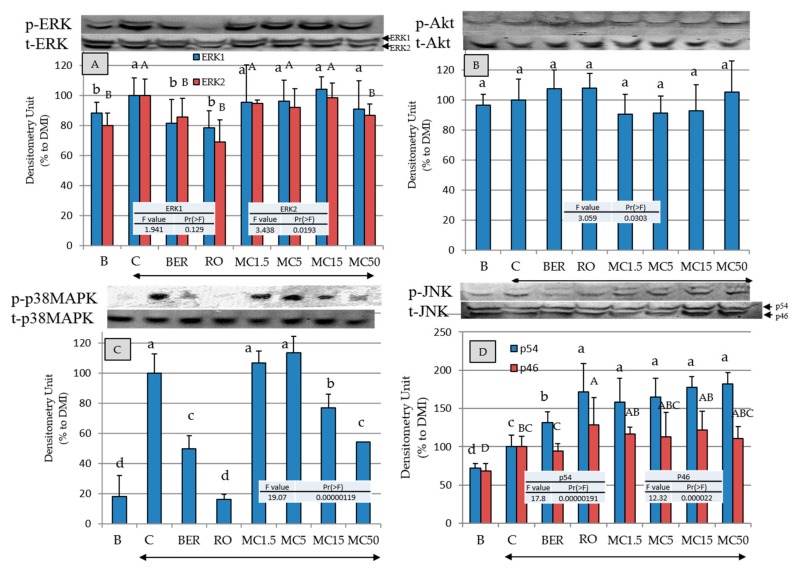
Figure 6.
The effects of each compound on the intracellular signal transduction-related protein levels in 3T3-L1 cells on day 8. Protein levels were measured by electroblotting. B (Black): Undifferentiated cells without the addition of the MDI, C (Control): cells with the addition of the MDI, BER: cells with MDI and berberine (2.7 nM), and RO: cells with MDI and rosiglitazone (100 nM). The number with MC indicate the concentration (µM). Arrows indicate the addition of the MDI mixture. Data are presented as the mean ± SD from three independent experiments. The same letters indicate that there are no differences between those groups, and different letters indicate significant differences (P < 0.05).

