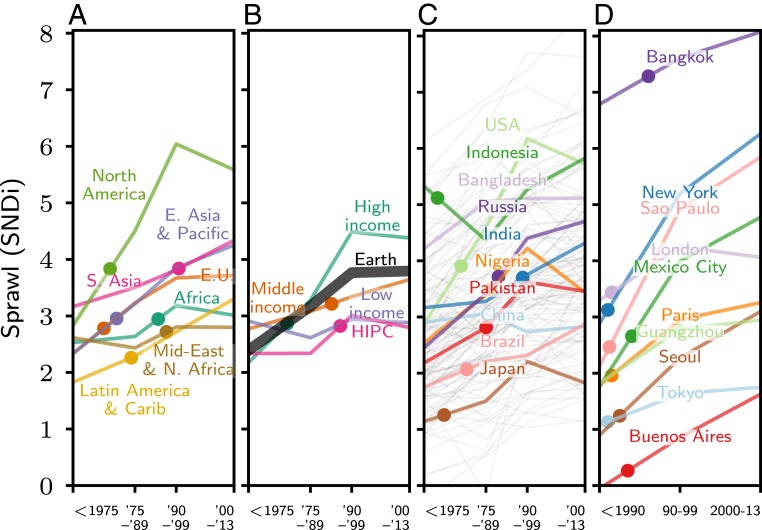
Fig. 2.
Regional trends in SNDi. A–C show levels of our composite sprawl measure for the stock of streets built prior to 1975 in urban areas, followed by the SNDi of new urban construction during each successive period, 1975 to 1989, 1990 to 1999, and 2000 to 2013 (16). The vertical positions of the circles denote the SNDi of the 2017 stock of streets. (A) Urban region averages of SNDi for several geographic regions. (B) The global urban region aggregate is shown with a thick dark gray line, along with trends for 4 World Bank-defined economic and cultural country groups (17), including the HIPC. (C) Trends for the 10 largest countries by population in color and for the next 90 largest countries in thin gray lines. (D) Trends for 10 large cities, based on time series of their urban development boundaries (18). Note that cities are aggregated to a separate set of time periods (prior to 1990, 1990 to 1999, and 2000 to 2013); see Materials and Methods for details.

