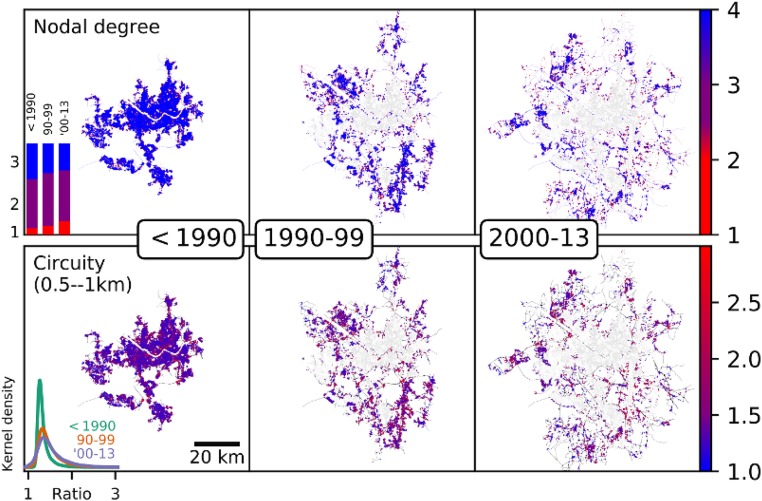
Fig. 3.
Map of nodal connectivity over time, Seoul. Blue streets are the most connected. Inset plots show the distribution of nodal degree (Top) and circuity (Bottom) for the 3 time periods. Streets built since 1990 on the urban periphery, particularly to the southeast and northwest, have become steadily more sprawling according to both of the connectivity measures illustrated here. A high-resolution version of this is in SI Appendix.

