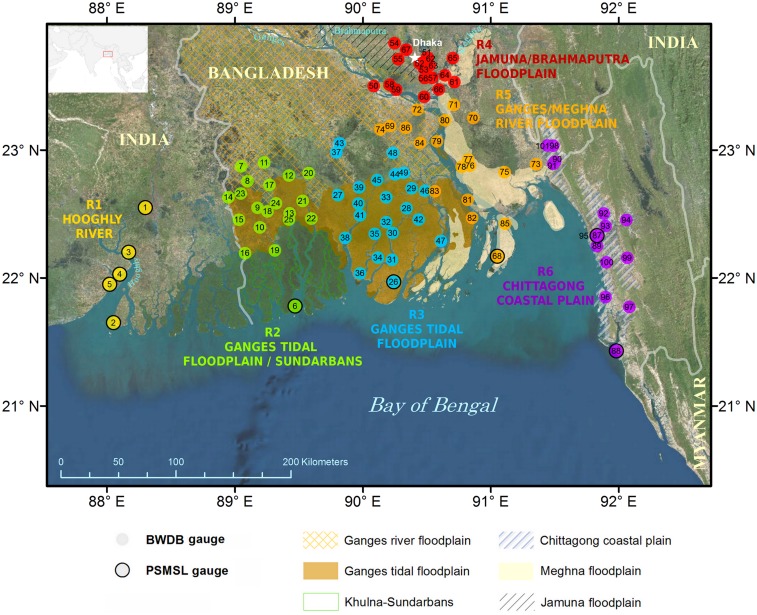
Fig. 1.
Map of the GBM delta region together with the location of stream/tide gauges from the Bangladesh Water Development Board (11) and tide gauges from the PSMSL and the 6 regions defined in this study. Each number corresponds to the station position in SI Appendix, Table S1. The physiographic units originate from Brammer et al. (72). GBM delta imagery basemap courtesy of Esri, DigitalGlobe, Earthstar Geographics, CNES/Airbus DS, GeoEye, USDA FSA, USGS, Aerogrid, IGN, IGP, and the GIS User Community.

