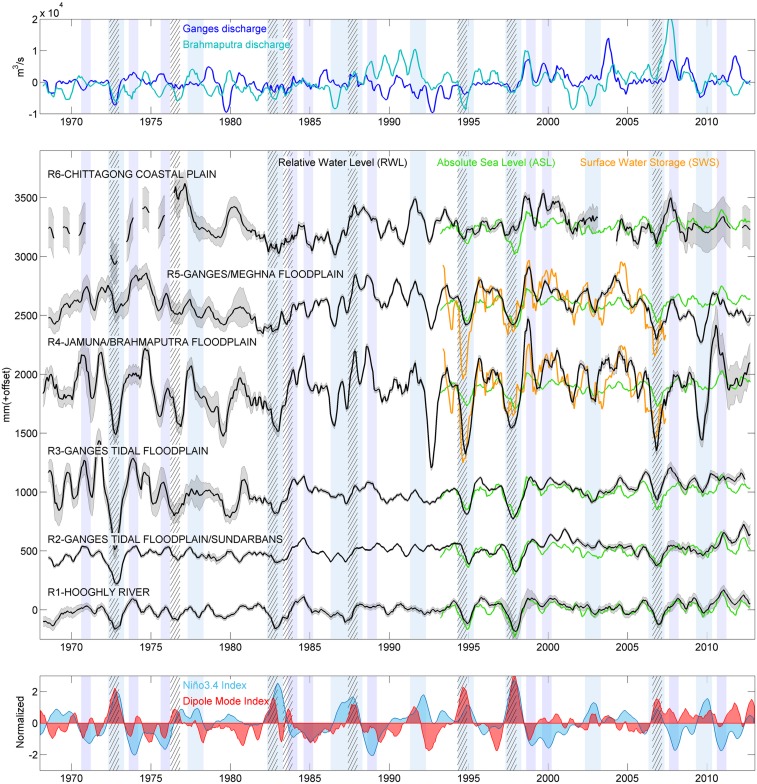
Fig. 2.
(Top) Deseasonalized anomalies (subtracting the long-term mean) of Ganges and Brahmaputra discharge time series. (Middle) Regional RWL reconstructed for the 6 regions over 1968 to 2012 (black line). Superimposed are the deseasonalized anomalies of the ASL from altimetry (green line) and the normalized deseasonalized anomalies of the SWS (orange line). (Bottom) Normalized Niño3.4 index (blue shade) and normalized Indian Ocean Dipole Mode index (red). A 6-mo running window was applied to all of the monthly time series. The light blue stripes indicate the El-Niño years and the light purple stripes the La Niña years. The black hatched stripes correspond to the positive IOD years.

