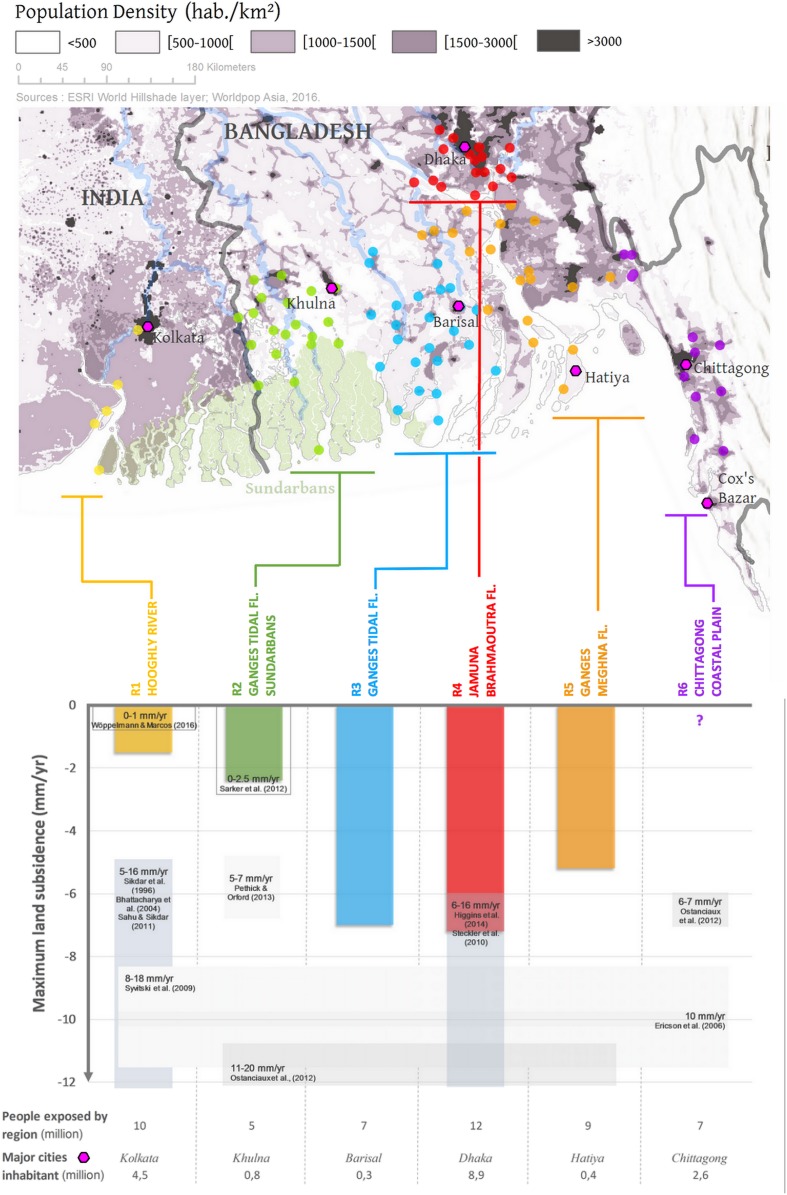
Fig. 4.
Map and maximum subsidence rates expected over the contemporary period. The solid colored bars correspond to the significant subsidence rates obtained in this study (upper bound of the likely range, Table 1). In R6, “?” means that we are not able to provide reliable information about the subsidence in this region. The shaded gray bars correspond to the subsidence rates obtained from the literature for the contemporary period. The 2015 population density (habitants per square kilometer) map is provided by Worldpop Asia (5). World Hillshade basemap courtesy of Esri, Airbus DS, USGS, NGA, NASA, CGIAR, N Robinson, NCEAS, NLS, OS, NMA, Geodatastyrelsen, Rijkswaterstaat, GSA, Geoland, FEMA, Intermap, and the GIS user community.

