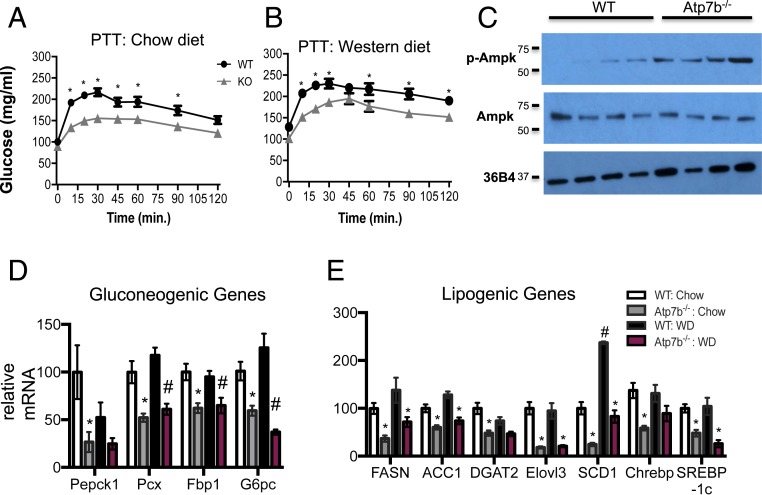
Fig. 3.
Fasted-state gluconeogenesis and AMPK activation. (A and B) PTT on Atp7b−/− and WT mice. (B) Western blot analysis of hepatic AMPK and p-AMPK levels in chow-fed 6-mo-old WT and Atp7b−/− mice. (C) Hepatic gluconeogenic and (D) lipogenic gene mRNA expression measured by real-time PCR analysis. (A and B) *P < 0.05, Atp7b−/− vs. WT diet-matched control, two-way ANOVA, and Sidak’s post hoc test. n = 4 to 11/group. (D and E) *P < 0.05 vs. WT chow; #P < 0.05 vs. WT WD; Student’s t test. n = 5 mice/group.

