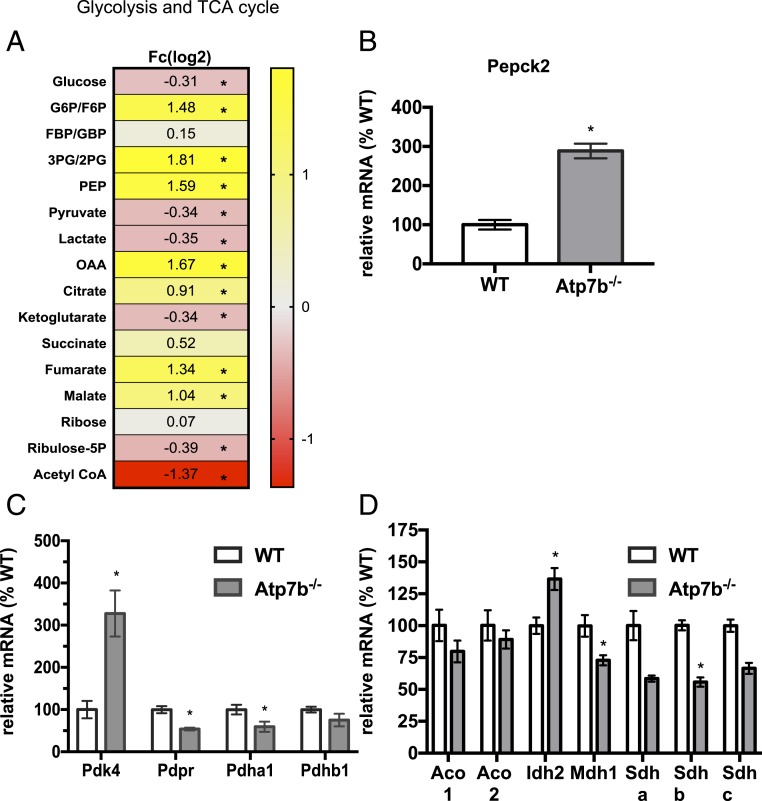
Fig. 4.
Hepatic metabolic changes in Atp7b−/− mice. (A) Hepatic glycolytic/TCA cycle metabolites significantly changed (B) hepatic Pepck2 mRNA, (C) hepatic regulators of the pyruvate dehydrogenase complex, and (D) hepatic TCA cycle genes. (A) Student’s t test followed by false discovery rate (FDR) correction; *q < 0.25. n = 4 to 7 mice per group. (B–D) n = 5 to 11 mice per group. Student’s t test was used to determine differences between Atp7b−/− mice vs. WT controls; *P < 0.05 vs. WT.

