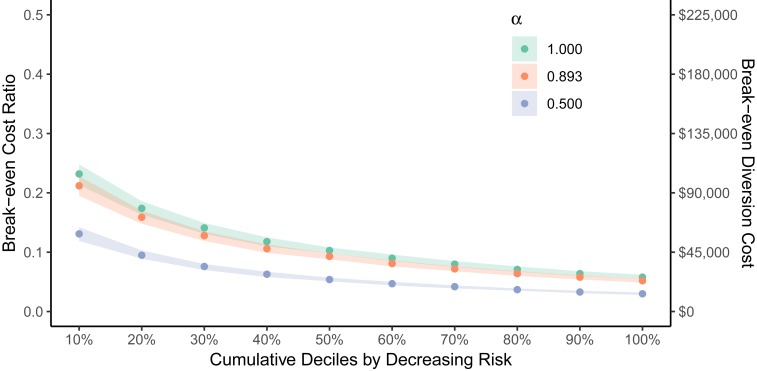
Fig. 2.
The break-even cost ratio for three values of the efficacy rate . The break-even cost ratio is the point at which the hypothetical policy becomes cost neutral. If the diversion cost is less than this ratio times the adverse outcome cost (estimated at $450,000), then the policy will be net beneficial. Lower diversion costs are required to make the policy net beneficial among lower risk scores. Error bars indicate the 95% confidence interval calculated from 100 bootstrap replicates.

