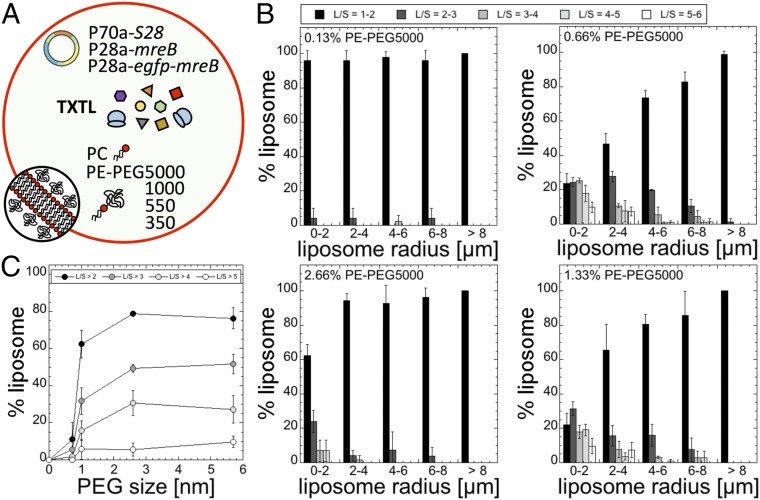
Fig. 3.
Statistics of liposome deformation (ratio L/S) as a function of the concentration of PE-PEG in the membrane (added to pure PC; % indicates molarity) and size of the PEG polymer attached to PE (350, 550, 1,000, 5,000 g/mol). (A) Schematic of the synthetic cell system. The PE-PEGs of different sizes were used separately. (B) Statistics of liposome deformation as a function of PE-PEG5000 added to PC for four concentrations: 0.13%, 0.66%, 1.33%, and 2.66%. The same experiment was done for PEG350, PEG550, and PEG1000 to make the plot in C. (C) Percentage of liposomes of radius comprised between 0 and 2 µm that have an L/S larger than either 2, 3, 4, or 5 as a function of the PEG polymer physical size (350: 0.72 nm; 550: 1 nm; 1,000: 2.6 nm; 5000: 5.7 nm). The optimum PE-PEG concentrations (for which the greatest number of liposomes were deformed) were the following (% indicates molarity): 7% (350), 6% (550), 2.3% (1,000), and 0.66% (5,000).

