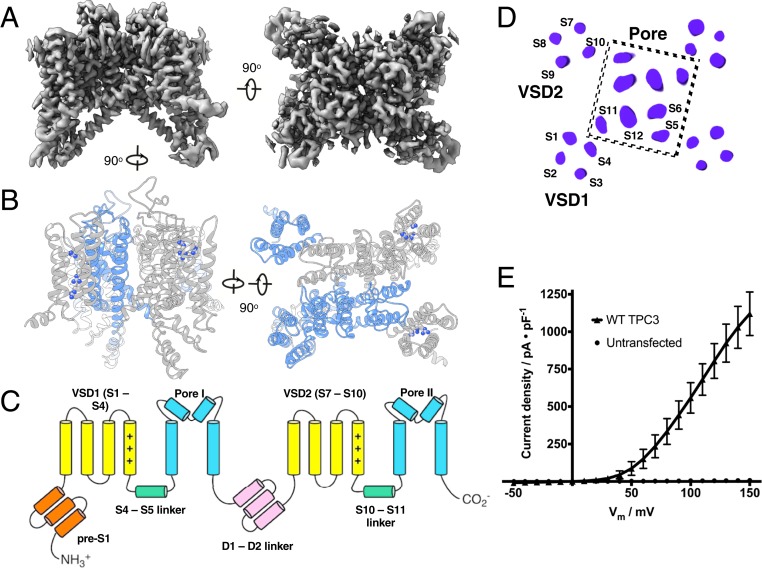
Fig. 1.
Cryo-EM structure of two-pore channel 3. (A) Orthogonal views of the Coulomb potential map of TPC3 sharpened with a B factor of −90 Å2. (B) Molecular model of TPC3 colored by a subunit to illustrate domain swapping of pore and voltage sensor domains (Right) and oriented to bring VSDs of the gray subunit to the front (Left). VSD2 is on the left. Arginine side chains of S4 and S10 are shown. (C) Annotated schematic of domain arrangement. (D) A 2D arrangement of helices, viewed normal to a central slice through the channel. (E) Current density of wild-type (WT) TPC3 showing its characteristic right-shifted response, determined by a whole cell voltage clamp on HEK293T cells. All recordings use symmetric [Na+] (n = 6 cells).

