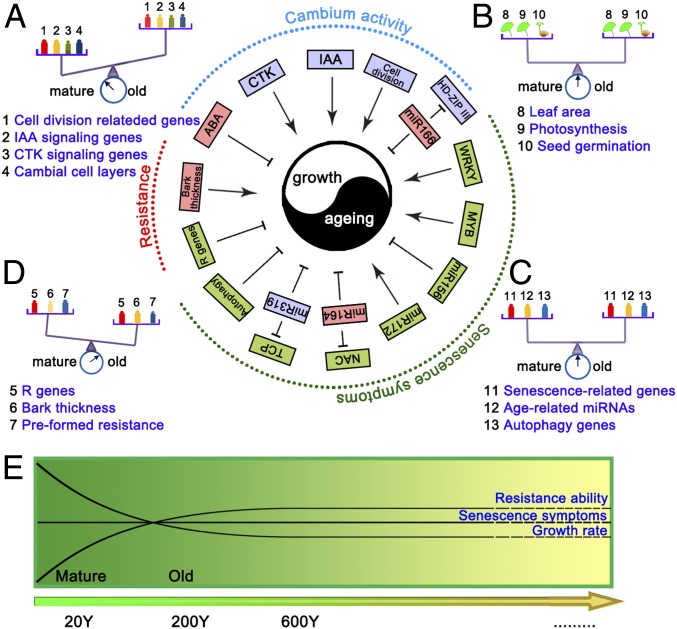
Fig. 7.
Schematic representation of the balance between aging and growth. The blue, red, and green boxes represent decreased, increased, and invariant index values in old trees, respectively. (A) Balance diagram; the balance between growth and aging is maintained by decreased cambium activity. (B and C) Old G. biloba trees lack senescence symptoms. (D) Resistance mechanisms delay senescence in old trees. The color gradation shows the values of indices. (E) Variation in growth rate, senescence symptoms, and the resistance ability with age.

