Fig. 2.
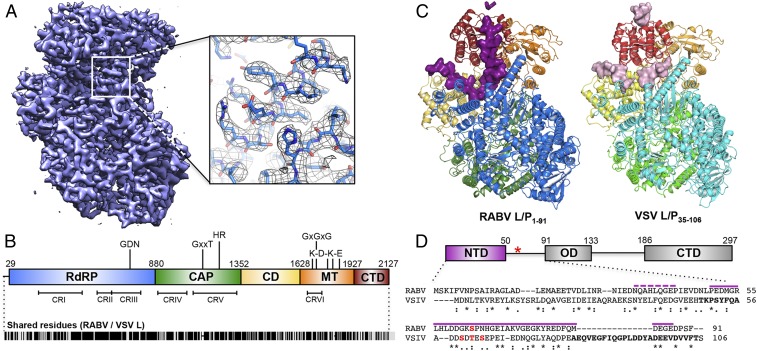
Structure of the RABV L-P complex. (A) A 3.3-Å cryo-EM map of RABV L-P1–91 and model fit into the density with clear side-chains even on exterior residues. (B) Domain organization of RABV L, with key catalytic residues listed. Numbers give amino acid positions at domain boundaries. (Below) Locations of conserved regions (CRI-VI) throughout NNS RNA virus L proteins and amino acid similarity score with VSV L (Indiana strain); black lines indicate identical residues (∼35%). (C) Structure of RABV L-P1–91 (Left) and the model of VSV L-P35–106 from a 3.0-Å cryo-EM map (Right) (7). Domains are colored as in B. P for both structures is shown in surface representation, colored in plum (RABV) and light pink (VSV). The five unassigned residues of RABV P are represented in plum ribbon. (D) Domain organization of RABV P (Top) amino acid positions (red asterisk, position of Ser63P, typically phosphorylated). (Below) Alignment with VSV P (purple lines, modeled RABV P residues; boldface letters, modeled VSV P residues; asterisks, shared residues; colons, chemically similar residues; periods, weakly similar residues; red, phosphorylation sites).

