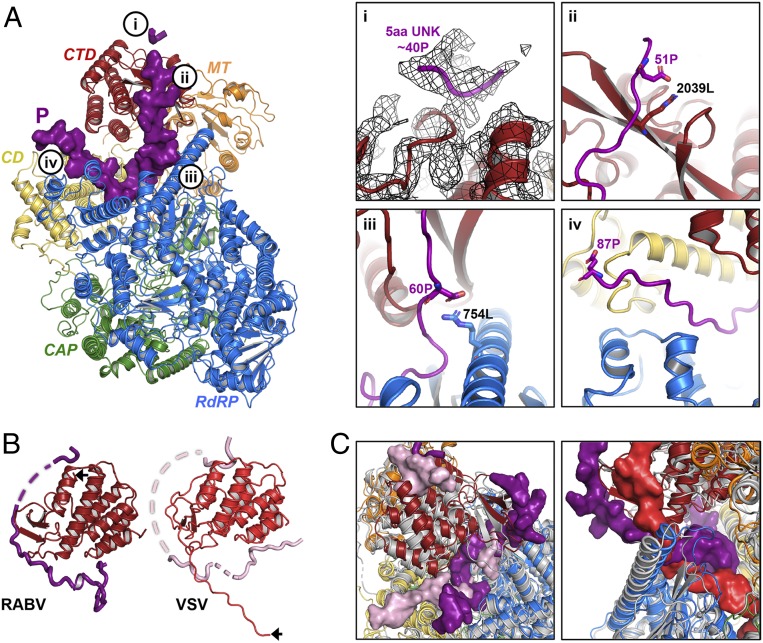
Fig. 3.
Association of RABV P1–91 with L. (A, Left) RABV L-P1–91 as in Fig. 2C. Bubbled letters indicate the regions shown in greater detail in i–iv on the Right. (A, Right) (i) Unassigned residues of P at the top of the CTD with the 3.3-Å map in black mesh. (ii–iv) Indicated residues of L (black) and P (purple) in stick representation. (B) CTDs of RABV and VSV L; P is in plum for RABV and light pink for VSV. Black arrows indicate the C-terminal residues of each L. (C) Superposition of RABV L (colored cartoon, as in Fig. 2) and VSV L (gray cartoon). (Left) Different paths taken by RABV P (plum, surface) and VSV P (light pink, surface) through L. (Right) RABV P (plum, surface) is partially coincident with the VSV C-tail (red, surface) in the interdomain cavity of L, while VSV P occupies far less of the same cavity.

