Fig. 1.
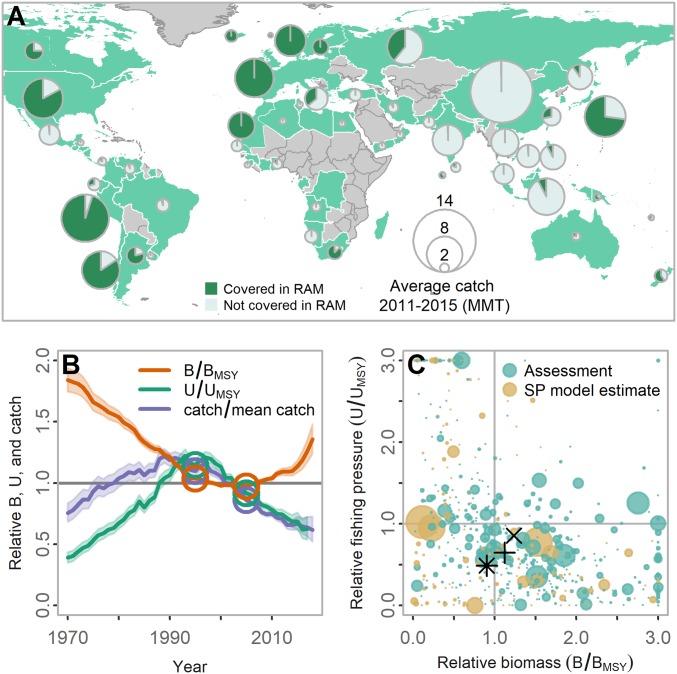
Global status of assessed fish and invertebrate stocks. (A) RAM Legacy Stock Assessment Database Version 4.44 coverage, showing countries with (pale green) and without (gray) data included. Pies are displayed for the top 50 countries by catch. Circle area of countries or groups of countries is proportional to landed tonnage reported to the FAO; dark green shaded pie areas are proportions of total landings accounted for by stocks in RAM Legacy Database. (B) State-space model estimates of geometric mean B/BMSY, U/UMSY and catch/(mean catch) from 1970 to 2016, rescaled to the median in years of high coverage. All stocks are given equal weight. Circles denote years 1995 and 2005. Shaded regions denote 95% finite population corrected confidence bounds. (C) Status of individual stocks in their latest year of assessment. Circle areas represent estimated MSY of the stock. Circles shaded green use reference points from stock assessments; circles shaded orange use reference points estimated from biomass dynamics model fits. Overlaid symbols show bivariate summary statistics across stocks: median (+), geometric mean with equal weighting (*), and geometric mean weighted by MSY (X).

