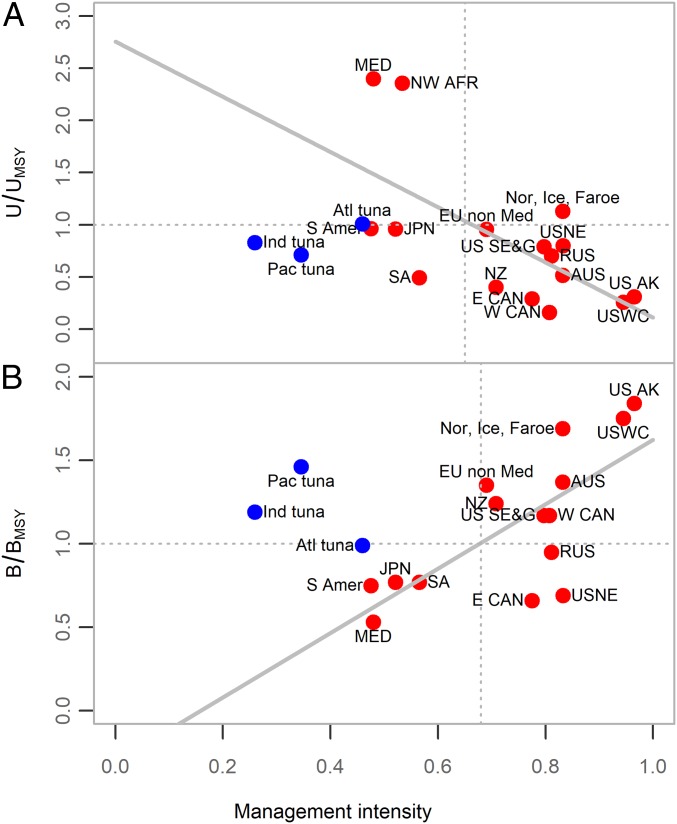
Fig. 4.
Relationship between regional geometric mean (rescaled to the median in years of high coverage) (A) U/UMSY and (B) B/BMSY and the joint management and enforcement scores for FMI surveys in corresponding regions. Blue points represent tuna fisheries from the Atlantic, Pacific, and Indian Oceans, and red points represent other regions shown in Fig. 2. Solid gray line is a linear fit to the data plotted in red. Dotted gray lines mark where U/UMSY or B/BMSY = 1 and where the best fit line intersects with U/UMSY or B/BMSY = 1. Abbreviations for regions are as follows: Atl tuna, Atlantic Ocean tunas; Ind tuna, Indian Ocean tunas; Pac tuna, Pacific Ocean tunas; AUS, Australia; E CAN, Canada East; W CAN, Canada West; EU non Med, EU non-Mediterranean; JPN, Japan; Med, Mediterranean; NZ, New Zealand; Nor, Ice, Faroe, Norway, Iceland, and Faroe Islands; NW AFR, NW Africa; RUS, Russia; SA, South Africa; S Amer, South America; US AK, US Alaska; USNE, US North East; US S&G, US Southeast and Gulf; USWC, US West Coast.

