Fig. 3.
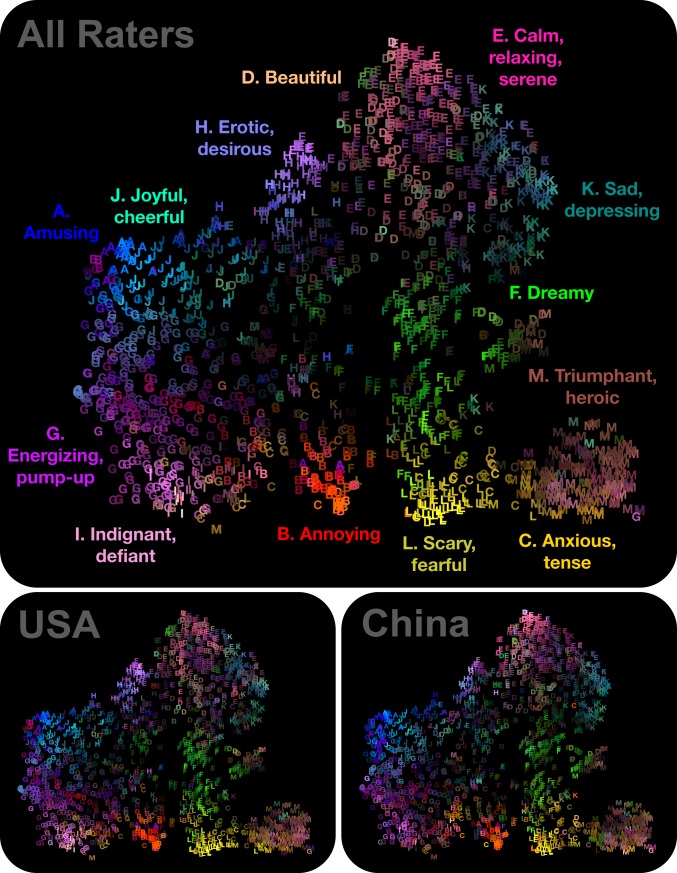
Visualizing the 13-dimensional structure of subjective experience evoked by music reveals smooth gradients between specific feelings in both cultures. To visualize the feelings associated with music, maps of average category judgments of the 1,841 music samples within a 13-dimensional categorical space of subjective experience were generated. t-SNE, a data visualization method that accurately preserves local distances between data points while separating more distinct data points by longer, more approximate, distances (42), was applied to the concatenated US and Chinese scores of the 1,841 music samples on the 13 categorical judgment dimensions, generating coordinates of each music sample on 2 axes (this does not mean the data are in fact 2D; see SI Appendix, SI Discussion). The individual music samples are plotted along these axes as letters that correspond to their highest-loading judgment dimension (with ties broken alphabetically) and are colored using a weighted average of colors corresponding to their scores on the 13 dimensions (see SI Appendix, Methods S8, for details). The resulting map reveals gradients in subjective experience, such as a gradient from anxious to triumphant music. For an interactive version of this map, visit https://www.ocf.berkeley.edu/∼acowen/musicval.html. Maps colored using projections of the mean US judgments only (Top Right) and Chinese judgments only (Bottom Right) on the same 13 dimensions demonstrate that reported experiences of the 13 distinct feelings associated with music and smooth gradients between them is largely preserved across the 2 cultures.

