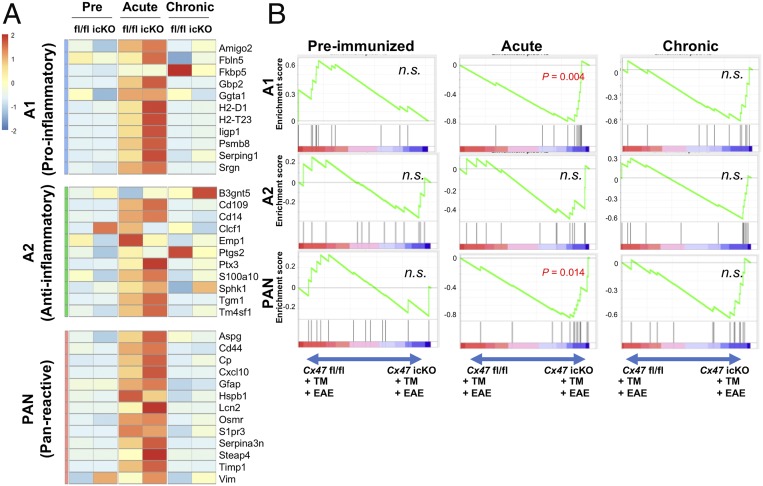
Fig. 4.
Gene expression microarray data for Cx47 icKO and Cx47 fl/fl mouse spinal cord and brain in the preimmunized and EAE phases focusing on astroglia-related genes. (A) Heat maps comparing the expression of A1-specific, A2-specific, and Pan-reactive gene transcripts in RNA samples from the spinal cord and brain of Cx47 icKO and Cx47 fl/fl mice (n = 3 per group) in the preimmunized, acute (dpi 17), and chronic (dpi 50) phases of EAE. To create the heat maps, the original mRNA signal values were subjected to log2 transformation, and the distance from the median value (control) of each gene was calculated. The numbers −2 to 2 beside the color bar indicate log2-transformed fold changes, reflecting fold differences in gene expression from less than 1/4 to more than 4, respectively. (B) Enrichment plots (green curves) show the running sums of the enrichment score (ES) for A1-specific, A2-specific, and Pan-reactive gene sets in the preimmunized, acute, and chronic phases of EAE. The score at the peak of each plot is the ES for that gene set. The black bars indicate where the members of the gene set appear in the ranked list of genes. A predominance of black bars to the left or right side indicates that most genes are up-regulated in Cx47 fl/fl or Cx47 icKO EAE mice, respectively. n.s., not significant.

