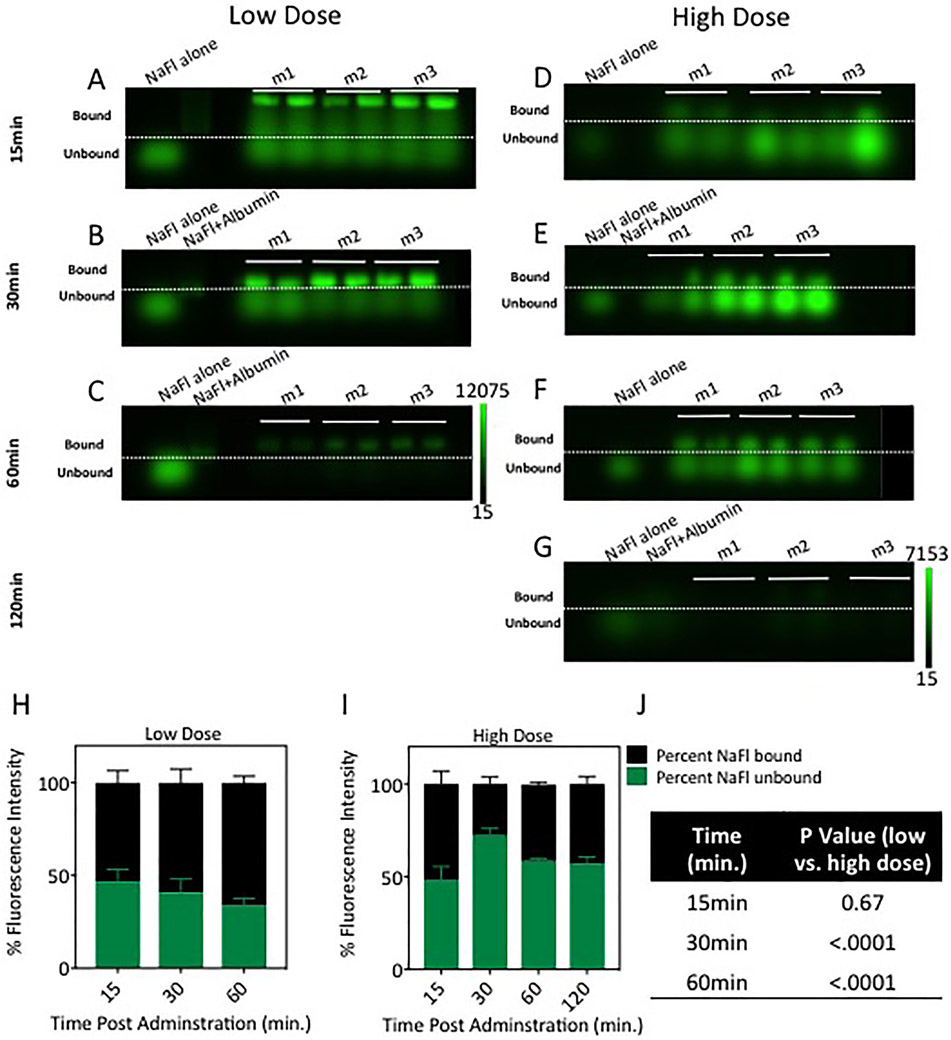
Fig. 2.
Quantification of unbound and bound NaFl in the blood circulation. Gel electrophoresis images of NaFl in blood serum at different times after administration are presented in A–G; low-dose administration data are shown in A–C and high dose in D–G. In a given gel panel, the columns represent, from left to right, the following: control containing diluted stock unbound NaFl (NaFl alone), control containing stock NaFl prebound to albumin (NaFl+Albumin), and blood samples from each of 3 mice (m1, m2, and m3 [2 samples were run per mouse]). The dashed lines delineate bound NaFl (above the dotted line) from unbound NaFl (below the dashed line), which were separated by weight in the gel. The percentages of the total fluorescent signal originating from the unbound and bound NaFl, computed from the gel images, are shown in H and I. Table of p values showing the difference in the percentage of unbound fluorescein between low- and high-dose cohorts at 15, 30, and 60 minutes postadministration is shown in J. Figure is available in color online only.

