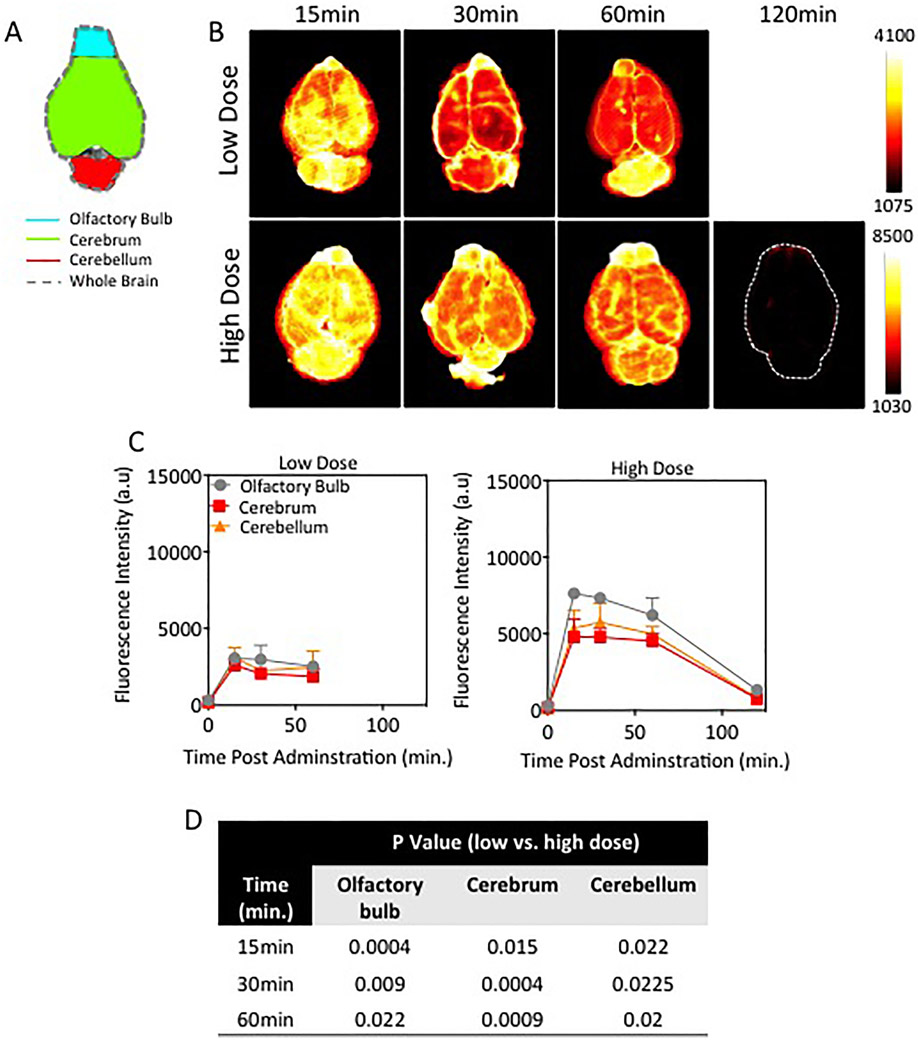
Fig. 4.
Superficial distribution of NaFl in the naive rodent brain. A: Schematic of mouse brain outlining ROIs (olfactory bulb, cerebrum, and cerebellum) analyzed for spatial and temporal distribution of NaFl. B: Representative fluorescence images of ex vivo naïve brains at different times after administration of low- or high-dose NaFl. C: Time-dependent NaFl fluorescence intensity in normal brain regions (n = 3–4 mice/time point/dose). D: Table of p values showing the difference in the amount of superficial fluorescein fluorescence between low- and high-dose experimental cohorts is exhibited. Figure is available in color online only.

