Fig. 4.
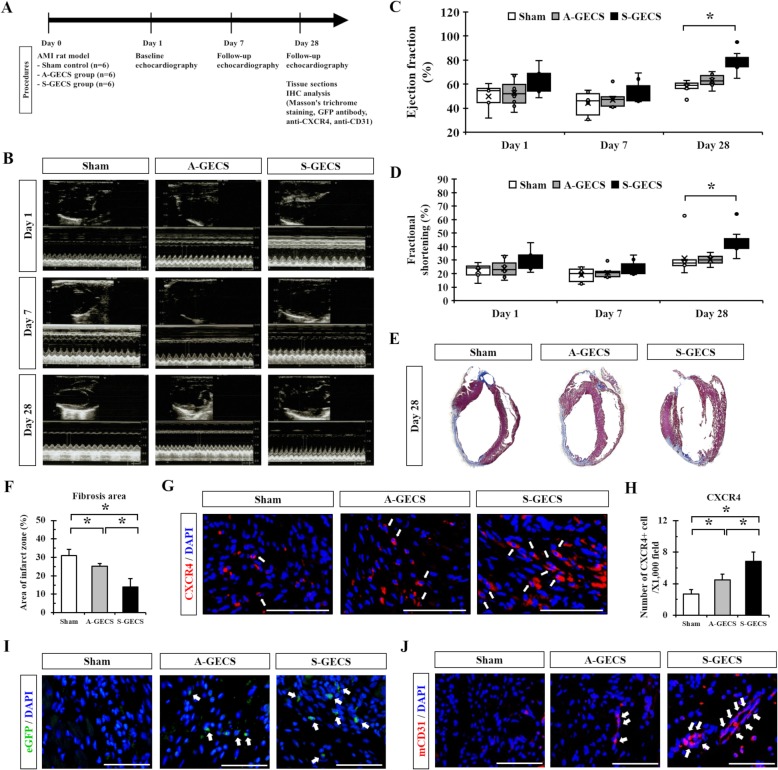
S-GECS transplantation into infarcted myocardium and cardiac regeneration. a Schematic diagram of S-GECS transplantation into infarcted myocardium. b Representative echocardiographic images at 1, 7, and 28 days following cell transplantation. c and d Cardiac function assessed by EF and FS at 1, 7, and 28 days following cell transplantation among three groups. n = 4, 5, and 5 rats in each group, *p < 0.05. e and f Masson’s trichrome staining on tissue sections after transplantation to determine the degree of fibrosis in A-GECS and S-GECS groups. *p < 0.05. g and h CXCR4 expression in the border zone in the S-GECS group. *p < 0.05. Nuclei were stained with DAPI (blue). i Representative images showing eGFP-positive transplanted cells in the border zone at 28 days of transplantation. Nuclei were stained with DAPI (blue). j Endothelial marker mCD31 expression in the border zone in the S-GECS group. Nuclei were stained with DAPI (blue). All quantification analyzed using images from n = 4, 5, and 5 rats in each group, each measured in triplicate. All results are representative; scale bars represent 100 μm

