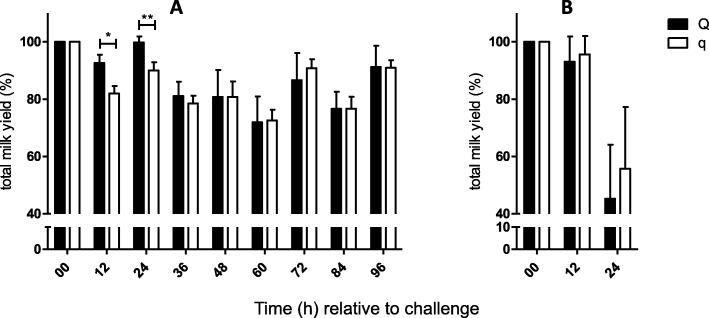
Fig. 4.
Graphical illustration of total milk yield from Q-/q-uniparous cows after intramammary challenge. Total milk yield in percent (%) relative to total milk yield at the start of the challenge (0 h) of uniparous cows after intramammary challenge with (a) Staphylococcus aureus (Q: n = 12 versus q: n = 12) and (b) Escherichia coli (Q: n = 6 versus q: n = 6) is shown. Milking was performed every 12 h after challenge, and total milk yield was determined. Data are presented as the mean and standard error of the mean (a) as the median and interquartile range (b). Differences between uniparous cows selected for favorable (Q) and unfavorable (q) haplotypes are indicated with * if P < 0.05 and with ** if P < 0.01. Significant differences within the haplotype groups over time relative to challenge are not shown

