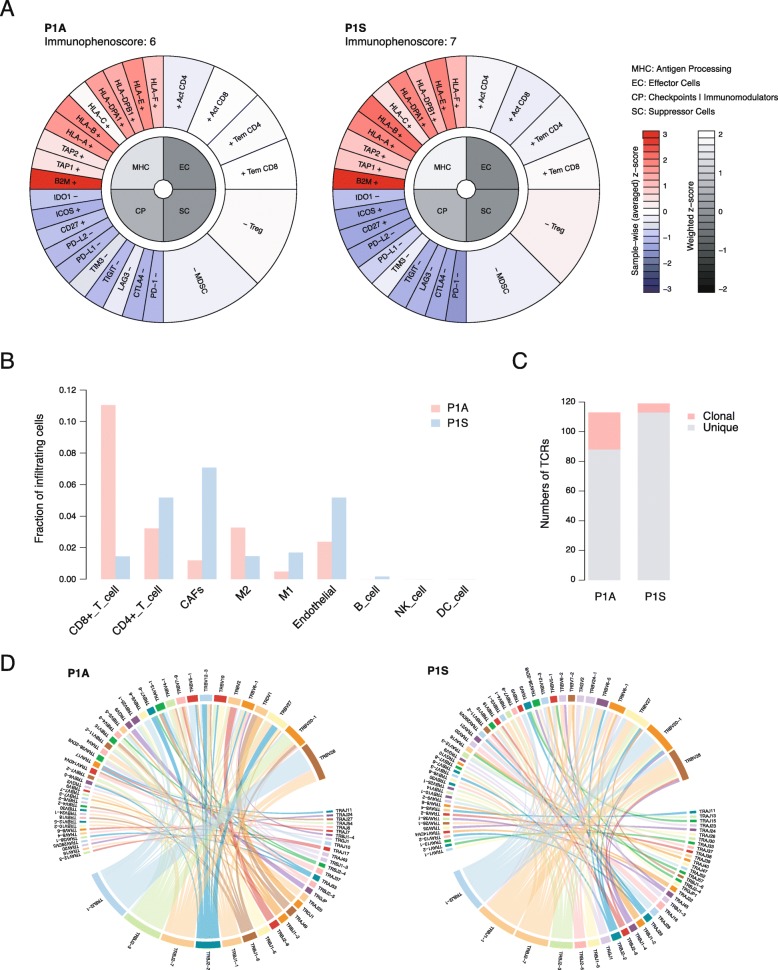
Fig. 4.
Tumor microenvironments. a Immunophenoscore of P1A and P1S. b Fractions of infiltrating cells. CAFs, cancer-associated fibroblasts. M1, macrophage M1. M2, macrophage M2. NK cell, natural killer cells. DC cell, dendritic cell. c Numbers of T cell receptors (TCRs). d Distribution of TCR V gene and J gene usages

