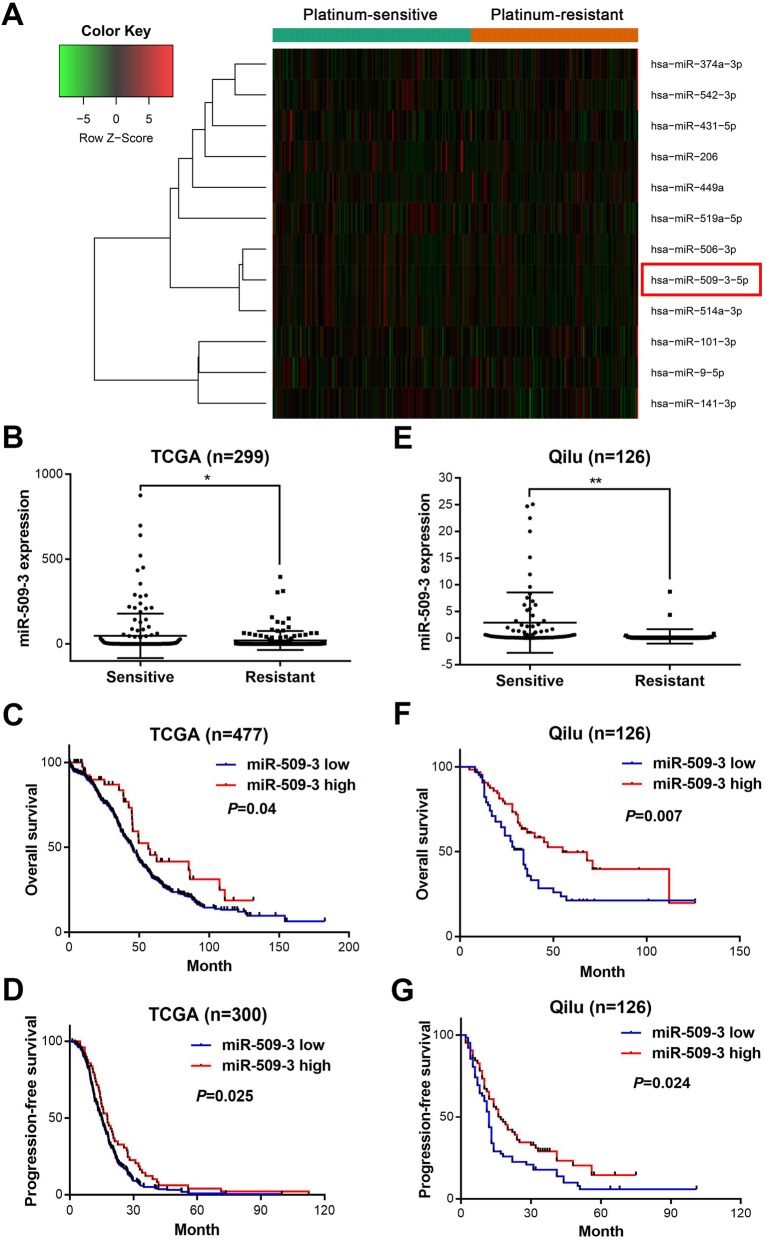
Fig. 1.
MiR-509-3 is significantly increased in P-sen group and indicated better prognosis. a The TCGA cohort was divided into two groups according to the clinical dataset: platinum-sensitive group (n = 159) and platinum-resistant group (n = 140). Heat map was drawn by DEGseq R package and illustrated the six top increased miRNAs and 6 top decreased miRNAs between two groups. b MiR-509-3 expression is elevated in platinum-sensitive group compared with platinum-resistant group in TCGA cohort (P < 0.05). c Overall survival (OS) and d progression-free survival (PFS) in survival curves for TCGA cohort with miR-509-3 low expression or high expression (high vs low miR-509-3 expression: OS, hazard ratio = 0.644, 95% confidence interval (CI) = 0.48 to 0.99 vs. hazard ratio = 1.551, 95% CI = 1.008 to 2.083, P < 0.04; PFS, hazard ratio = 0.708, 95% CI = 0.546 to 0.956 vs. hazard ratio = 1.412, 95% CI = 1.045 to 1.829, P < 0.02). e Relative miR-509-3 expression level was detected by RT-qPCR in 126 HGSOC patients from Qilu hospital. The platinum-sensitive group exhibited higher miR-509-3 expression level than platinum-resistant group (P < 0.01). f OS and g PFS in Qilu hospital cohort which was stratified into miR-509-3 low and high expression group whose cutoff value was defined by the medium (high vs. low miR-509-3 expression: OS, hazard ratio = 0.550, 95% CI = 0.334 to 0.830 vs. hazard ratio = 1.817, 95% CI = 1.205 to 2.987, P = 0.007; PFS, hazard ratio = 0.657, 95% CI = 0.432 to 0.929 vs. hazard ratio = 1.522, 95% CI = 1.076 to 2.314, P = 0.024)

